


Stock Market Talking Points:
- The Dow Jones will look for Tuesday’s service sector data to revive optimism and re-test technical resistance
- ISM non-manufacturing data is due at 8:00 AM EST, expected 57.3 versus 56.7 previous
- View our economic calendar for real-time data updates on all the major economies
See how IG clients are positioned on the Dow Jones, Crude oil and the US Dollar with our free IG Client Sentiment Data.
Tuesday’s equity session has a lot to look for with the Dow Jones and S&P 500 now in precarious territory below key technical resistance. ISM non-manufacturing and services data is due before market open and will likely dictate sentiment and direction early in the equity session as services make up over two thirds of US GDP. With that in mind, XLP - an ETF that tracks the performance of US consumer staples - could be a source of volatility in the equity space during tomorrow’s New York session.
Dow Jones Price Chart: Daily Time Frame (October 2018 – March 2019) (Chart 1)

Dow Jones Price Chart overlaid with ratio of S&P 500 to XLP ETF
The XLP ETF has largely lagged the broader S&P 500 and Dow Jones in recent months, in part due to the sector’s ties to growth expectations. With the lowered GDP forecasts and broader equity weakness, XLP has fallen under pressure. Of the 30 corporations listed on the Dow Jones, 5 of them fall under the “services” category and together they account for roughly 17% of the index’s market capitalization. Further, a series of earnings reports from Target, Kohl’s and Ross are due tomorrow. The reports will offer deeper insight on the sector and could detract from or exacerbate any price action moves based off of the ISM-services data.
Dow Jones Price Chart: 1 – Hour Time Frame (October 2018 – March 2019) (Chart 2)
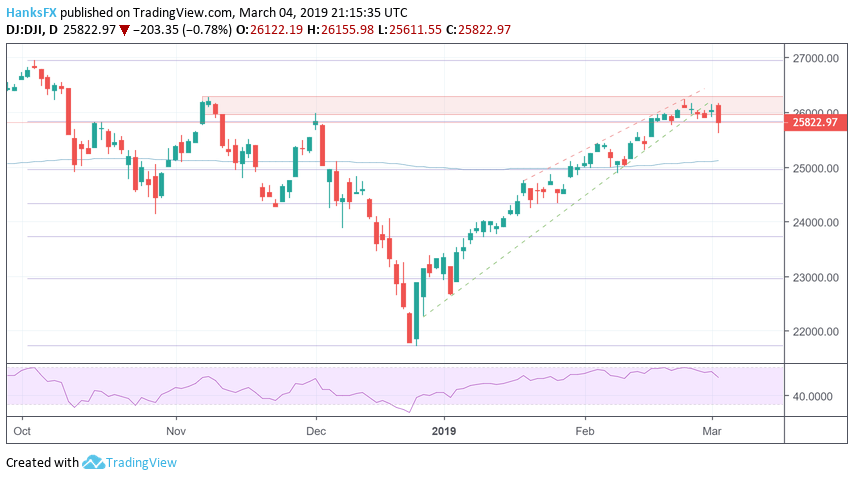
With that said, Tuesday’s service sector data could prove to be a headline catalyst for the industry which in turn could influence price action in the Dow Jones and S&P 500. As for the Dow Jones specifically, the industrial average closed Monday considerably lower than it opened, down about 0.80% as market participants faced waning trade optimism and technical resistance.
Looking to take your trading to the next level? Check out our free Advanced Trading Guides.
--Written by Peter Hanks, Junior Analyst for DailyFX.com
Contact and follow Peter on Twitter @PeterHanksFX
Read more: Stock Market Fund Inflows Return as S&P 500 Hits Technical Resistance
DailyFX forecasts on a variety of currencies such as the US Dollar or the Euro are available from the DailyFX Trading Guides page. If you’re looking to improve your trading approach, check out Traits of Successful Traders. And if you’re looking for an introductory primer to the Forex market, check out our New to FX Guide.


