


Gold Price Analysis and Talking Points:
- Gold Buying Persists, Eyes on FOMC Minutes
- Crucial Technical Resistance May Spark Inflection Point
See our quarterly gold forecast to learn what will drive prices throughout Q1!
Gold Buying Persists, Eyes on FOMC Minutes
Since the beginning of the year, Gold prices are up over 5%, trading at its highest level since April 2018 as global central banks take a more accommodative stance. Most notably the Federal Reserve who emphasized that not only would they be patient in rate hikes, they had also opened up to the idea that the balance sheet unwind may end sooner than what the markets expects. Consequently, investors have flocked to the non-yielding precious metal. Eyes will be on tonight’s FOMC minutes, whereby a dovish release could see gold push towards key resistance at $1350.
However, judging by the price action observed in the USD and gold yesterday, markets may have already positioned themselves for a dovish outcome, implying a slight near-term pullback if markets perceive the minutes as less dovish than expected. Outlook continues to remain bullish as global bond yields continue to dip.
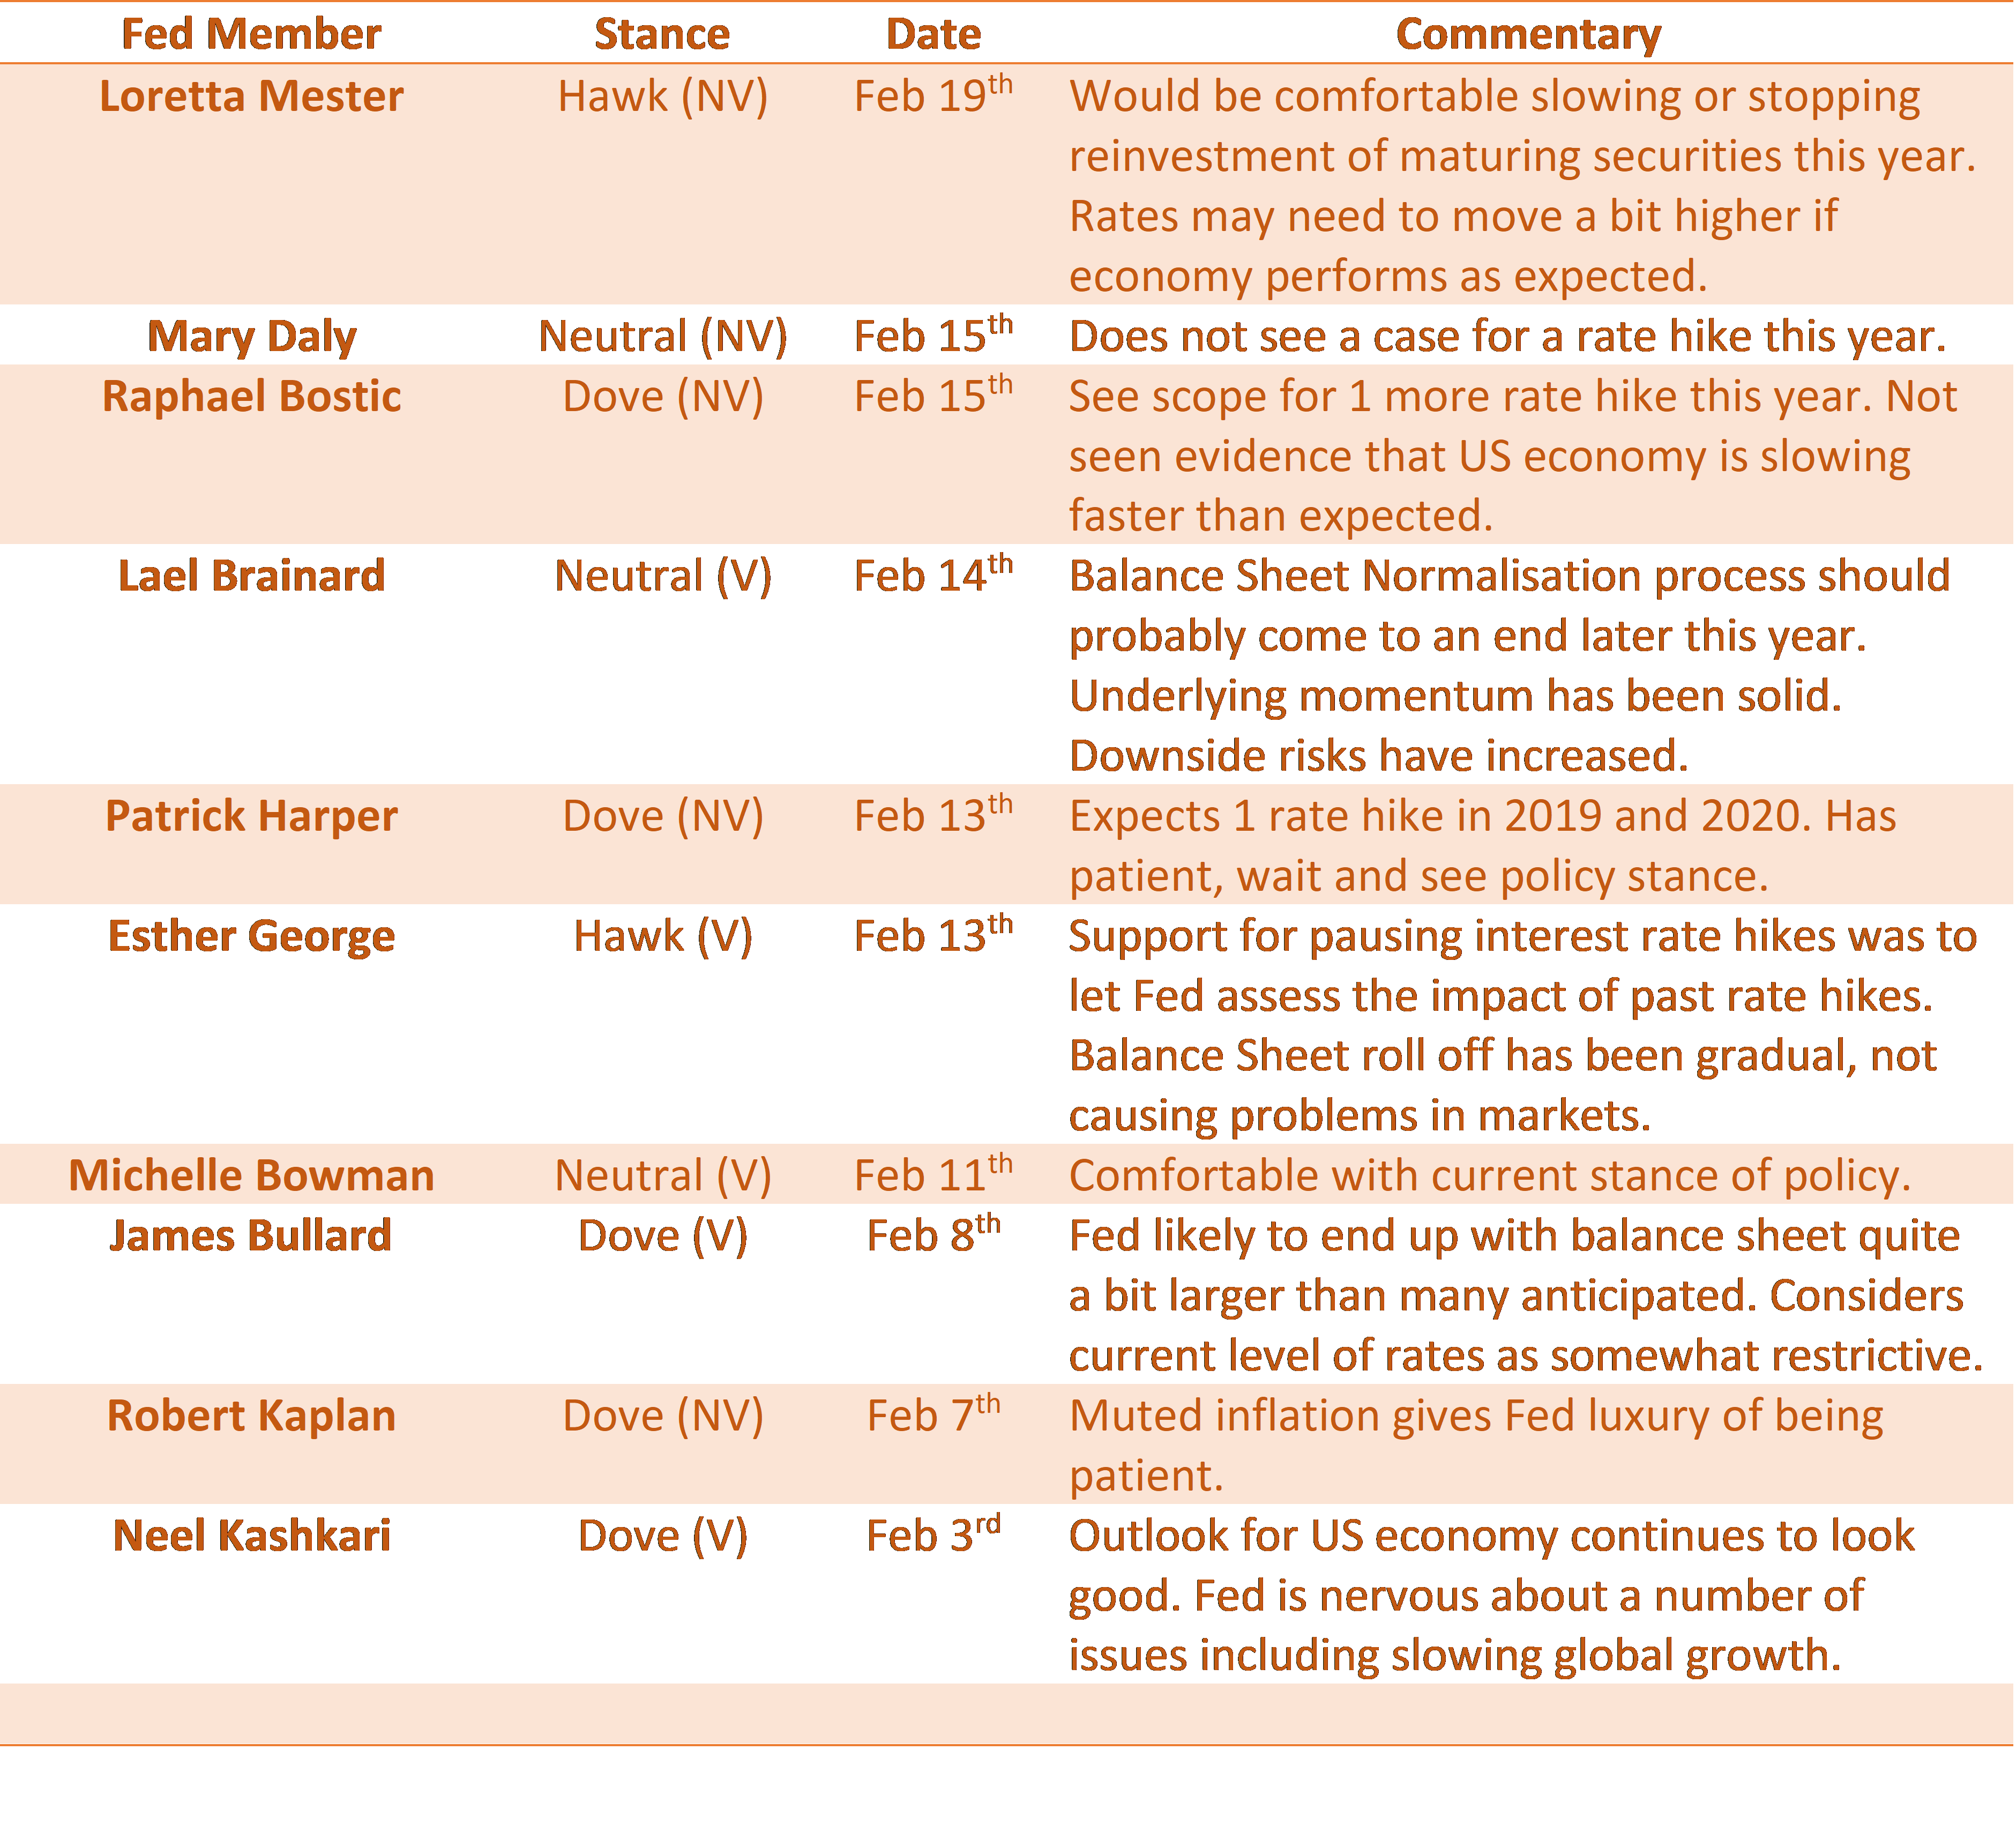
FOMC Tracker
Crucial Technical Resistance May Spark Inflection Point
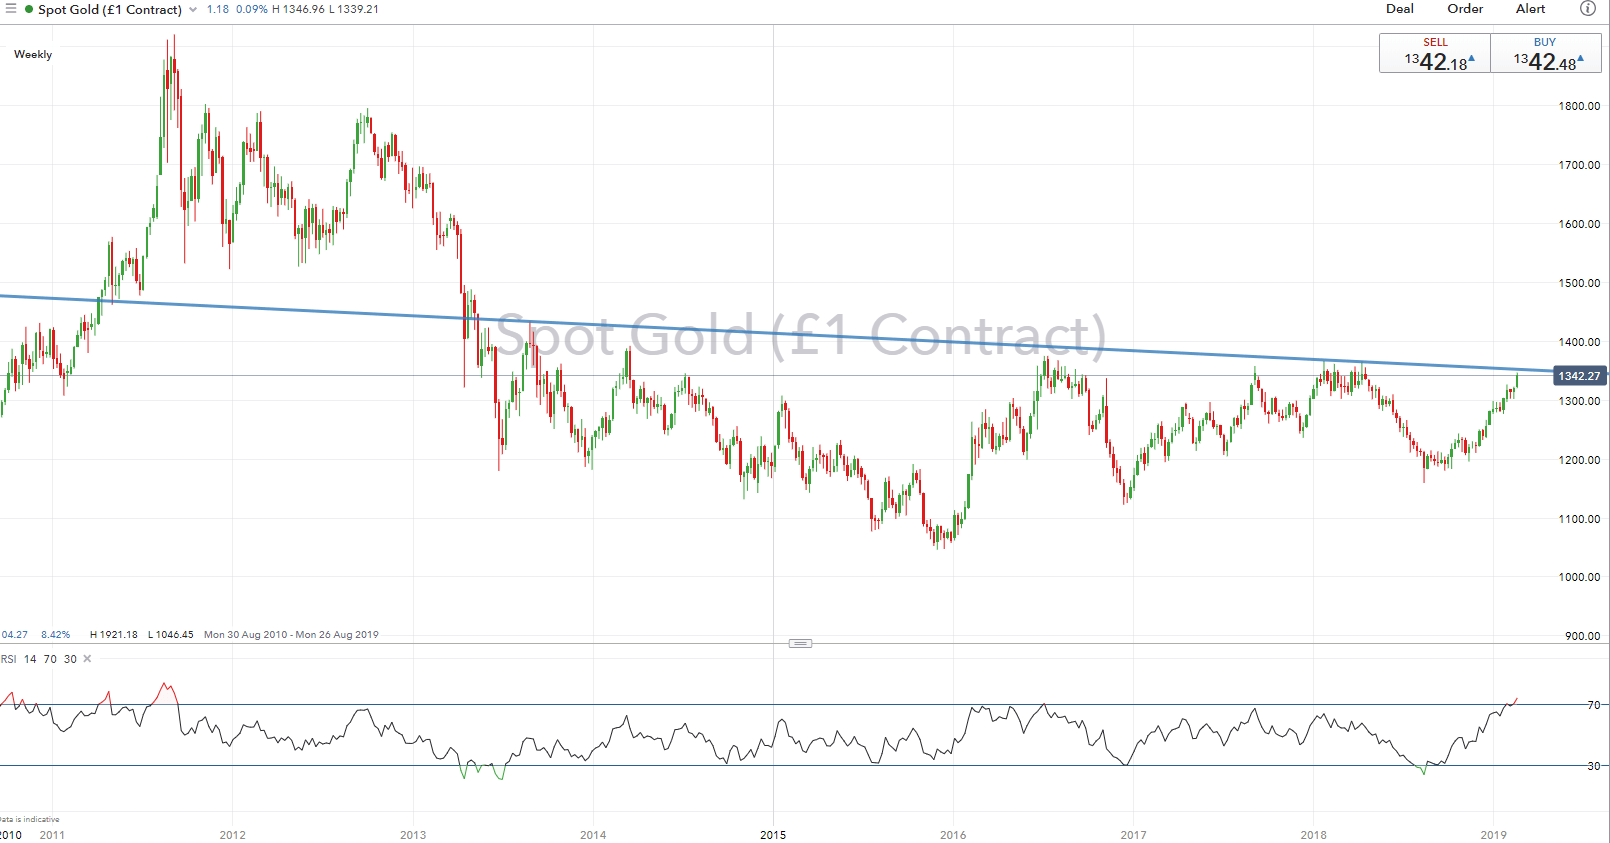
With the gold uptrend firmly intact, the precious metal is now eying key resistance at $1350, which marks the descending trendline from the August 2013 peak, potentially sparking a near-term pullback. However, a closing break above increases scope for a move towards the 2018 peak at $1365-66. Elsewhere, a slight negative divergence on the RSI also raises the potential for a pullback.
GOLD PRICE CHART: Daily Time-Frame (Jun 2018-Feb 2019)

GOLD PRICE CHART: Weekly Time-Frame (Aug 2010-Feb 2019)
RECOMMENDED READING
Gold Price Analysis: Fed Capitulation & Central Bank Buying Spree Maintains Bullish Outlook
What You Need to Know About the Gold Market
GOLD TRADING RESOURCES:
- See our quarterly gold forecast to learn what will drive prices through mid-year!
- Just getting started? See our beginners’ guide for FX traders
- Having trouble with your strategy? Here’s the #1 mistake that traders make
--- Written by Justin McQueen, Market Analyst
To contact Justin, email him at Justin.mcqueen@ig.com
Follow Justin on Twitter @JMcQueenFX


