


Gold Price Analysis and Talking Points:
- Less Dovish Than Expected Fed May Dent Gold Upside
- Technical Factors Suggest Near Term Pullback
See our quarterly gold forecast to learn what will drive prices through mid-year!
Less Dovish Than Expected Fed May Dent Gold Upside
Since the Federal Reserve’s U-Turn on monetary policy, in which rate setters have agreed to take a wait-and-see stance regarding interest rate rises. Gold prices have propelled higher, making a breach above $1300/oz for the first time since June 2018, with Fed Fund Futures pricing currently calling the end of the rate hiking cycle (Too dovish in our view). Alongside this, the deteriorating economic outlook and softening data has seen safe haven flows support the precious metal.
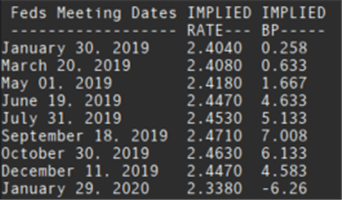
Source: Refinitiv
However, gold bulls expecting further upside in the short term could be left temporarily disappointed if the Fed is less dovish than what the markets expect. Given that rate guidance has been well telegraphed by Fed members, focus will predominantly center around the uncertainty that lies with the outlook of the Fed’s balance sheet. On Friday, gold saw its largest rise since October (rising 1.76%) after a report from WSJ that “Fed Officials are weighing an earlier than expected end to bond portfolio runoff”. As such, unless there are hints that this could be the case, gold could see a slight pullback. While we are bullish on the precious metal, we are somewhat cautious with this view in the short term.
Technical Factors Suggest Near Term Pullback
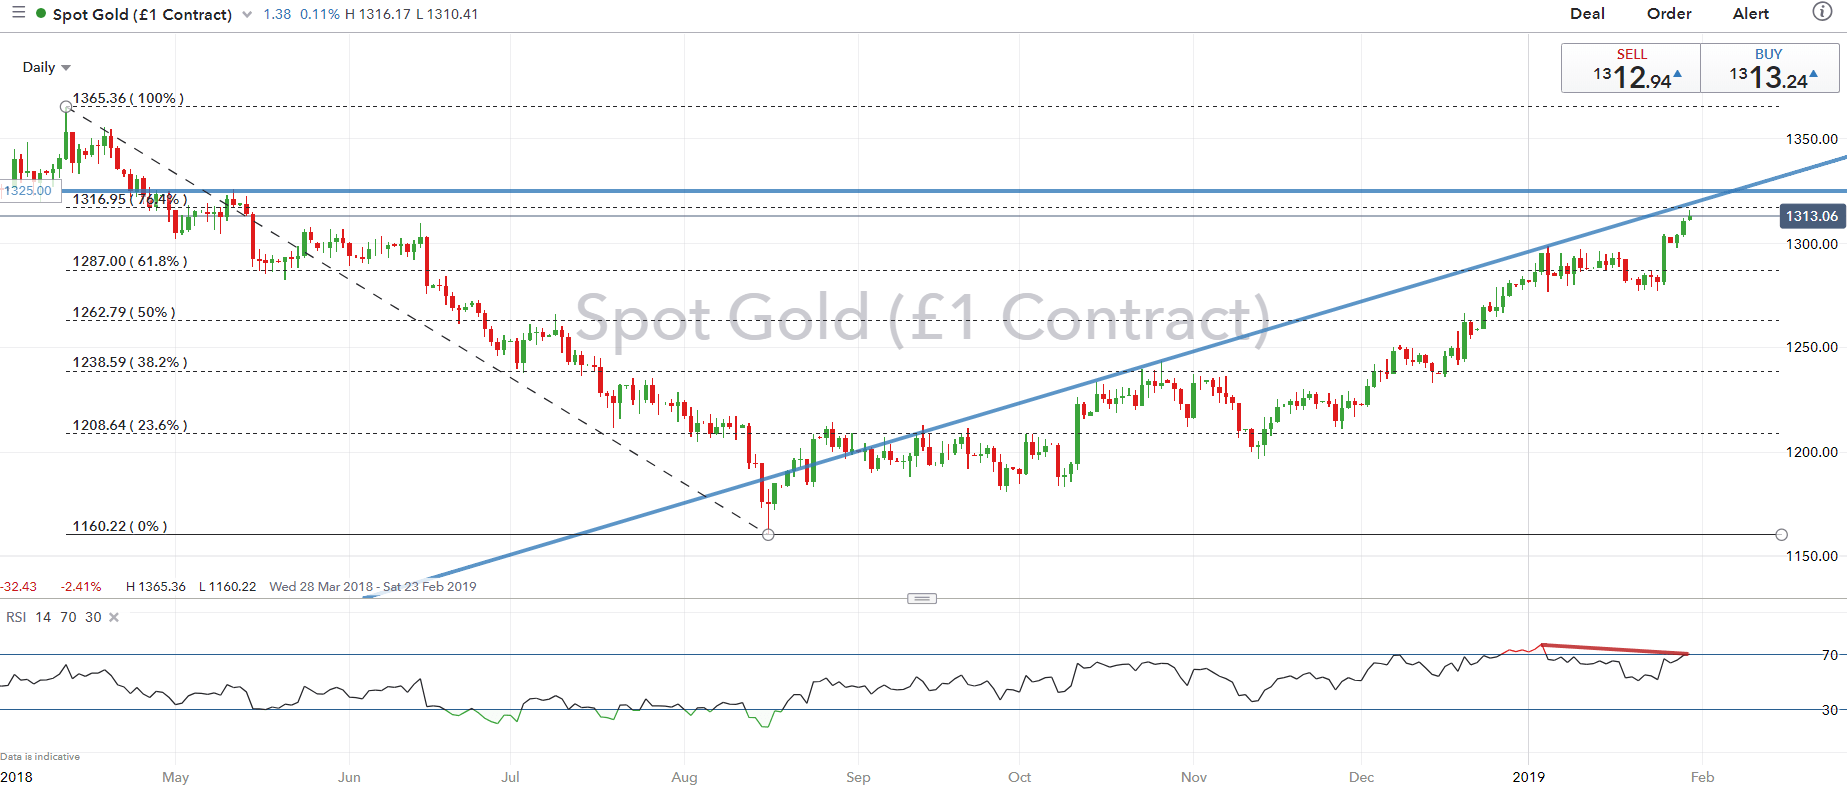
Short term technical indicators are signaling that gold prices may see a slight pullback. The RSI on the daily-time frame confirms a negative divergence, which also lies within overbought territory. This also coincides with rising trendline resistance situated at $1318.
On the longer term, bulls will eye a topside breach of $1325/oz (May 2018 high), which increases the likelihood of a test of the $1360.
What You Need to Know About the Gold Market
GOLD PRICE CHART: Daily Time-Frame (Mar 2018-Jan 2019)
GOLD TRADING RESOURCES:
- See our quarterly gold forecast to learn what will drive prices through mid-year!
- Just getting started? See our beginners’ guide for FX traders
- Having trouble with your strategy? Here’s the #1 mistake that traders make
--- Written by Justin McQueen, Market Analyst
To contact Justin, email him at Justin.mcqueen@ig.com
Follow Justin on Twitter @JMcQueenFX


