Gold Price, News and Chart:
- Gold touches its highest level since mid-June 2018.
- FOMC, US Q4 GDP and balance sheet news will determine the next move.
Q1 2019 Gold Forecast and Top Trading Opportunities
How to Trade Gold: Top Gold Trading Strategies and Tips
Gold Retains Gains Ahead of FOMC Meeting
Gold jumped sharply on Friday, and has kept its bid today, after news hit the market that the Fed officials have been discussing ending the current balance sheet reduction program shortly, a mildly US dollar negative scenario. The news, covered in multiple media outlets, suggested that the Fed are considering ending the shrinking of the government’s balance sheet which has seen a reduction of around $400 billion of bonds since the program started in October 2017. This would loosen monetary conditions marginally, a set-up that would allow Gold to move further higher.
On Wednesday, the first look at US Q4 Q/Q GDP is released with expectations of a decrease to 2.6% from 3.4% prior, a move that would suggest a short-term rate hike is very unlikely. Later in the session the latest FOMC meeting is expected to show all monetary policy measures left untouched. The post-FOMC press conference will then be closely monitored to see if Chair Jerome Powell gives any clues not only to future interest rate moves but also to any updated information on the balance sheet reduction program.
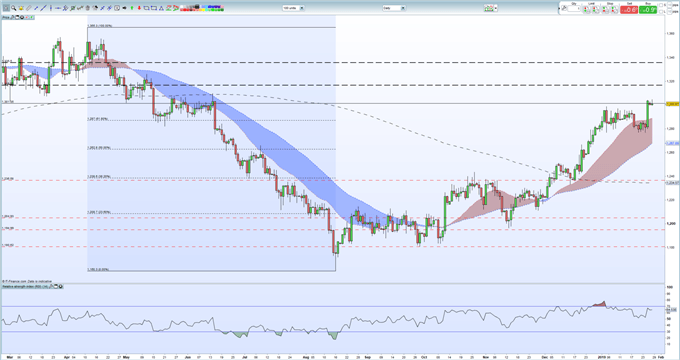
Spot Gold has broken through the $1,300/oz. ceiling but not with any great conviction so far. The precious metal still retains a bullish bias, trading comfortably above all three moving averages, although the RSI indicator points to a market that is at, or near, overbought territory, a set-up that may see Gold trade sideways ahead of Wednesday’s news and data.
Gold Daily Price Chart (March 2018 – January 28, 2019)

Retail traders are 64.4% net-long Gold according to the latest IC Client Sentiment Data, a bearish contrarian indicator. Recent changes in daily and weekly sentiment warn that the current spot Gold price may move higher however despite traders remaining net-long.
Traders may be interested in two of our trading guides – Traits of Successful Traders and Top Trading Lessons – while technical analysts are likely to be interested in our latest Elliott Wave Guide.
What is your view on Gold – bullish or bearish?? You can let us know via the form at the end of this piece or you can contact the author at nicholas.cawley@ig.com or via Twitter @nickcawley1.


