


Brent Oil and US Crude Oil Prices and Charts:
- Brent stabilizing around $60/bbl.
- Chinese stimulus and production cuts underpinning the price.
Crude Oil Price May Nudge Higher
The price of crude continues to trade around $60/bbl. and above both the 20- and 50-day moving averages, propped up by a positive fundamental backdrop. Overnight the Chinese central bank (PBoC) boosted market liquidity by a record $83 billion in a further attempt to boost the country’s flagging economy. Recent official data showed Chinese manufacturing slowing down, while both annual CPI and PPI prints missed expectations. In addition, the recent OPEC+ oil cuts continue to support Brent crude, via reduced inventory, although they will need to be adhered to in the face of a slowing global economy. The next OPEC meeting is scheduled for mid-April.
How to Trade Oil – Crude Oil Trading Strategies
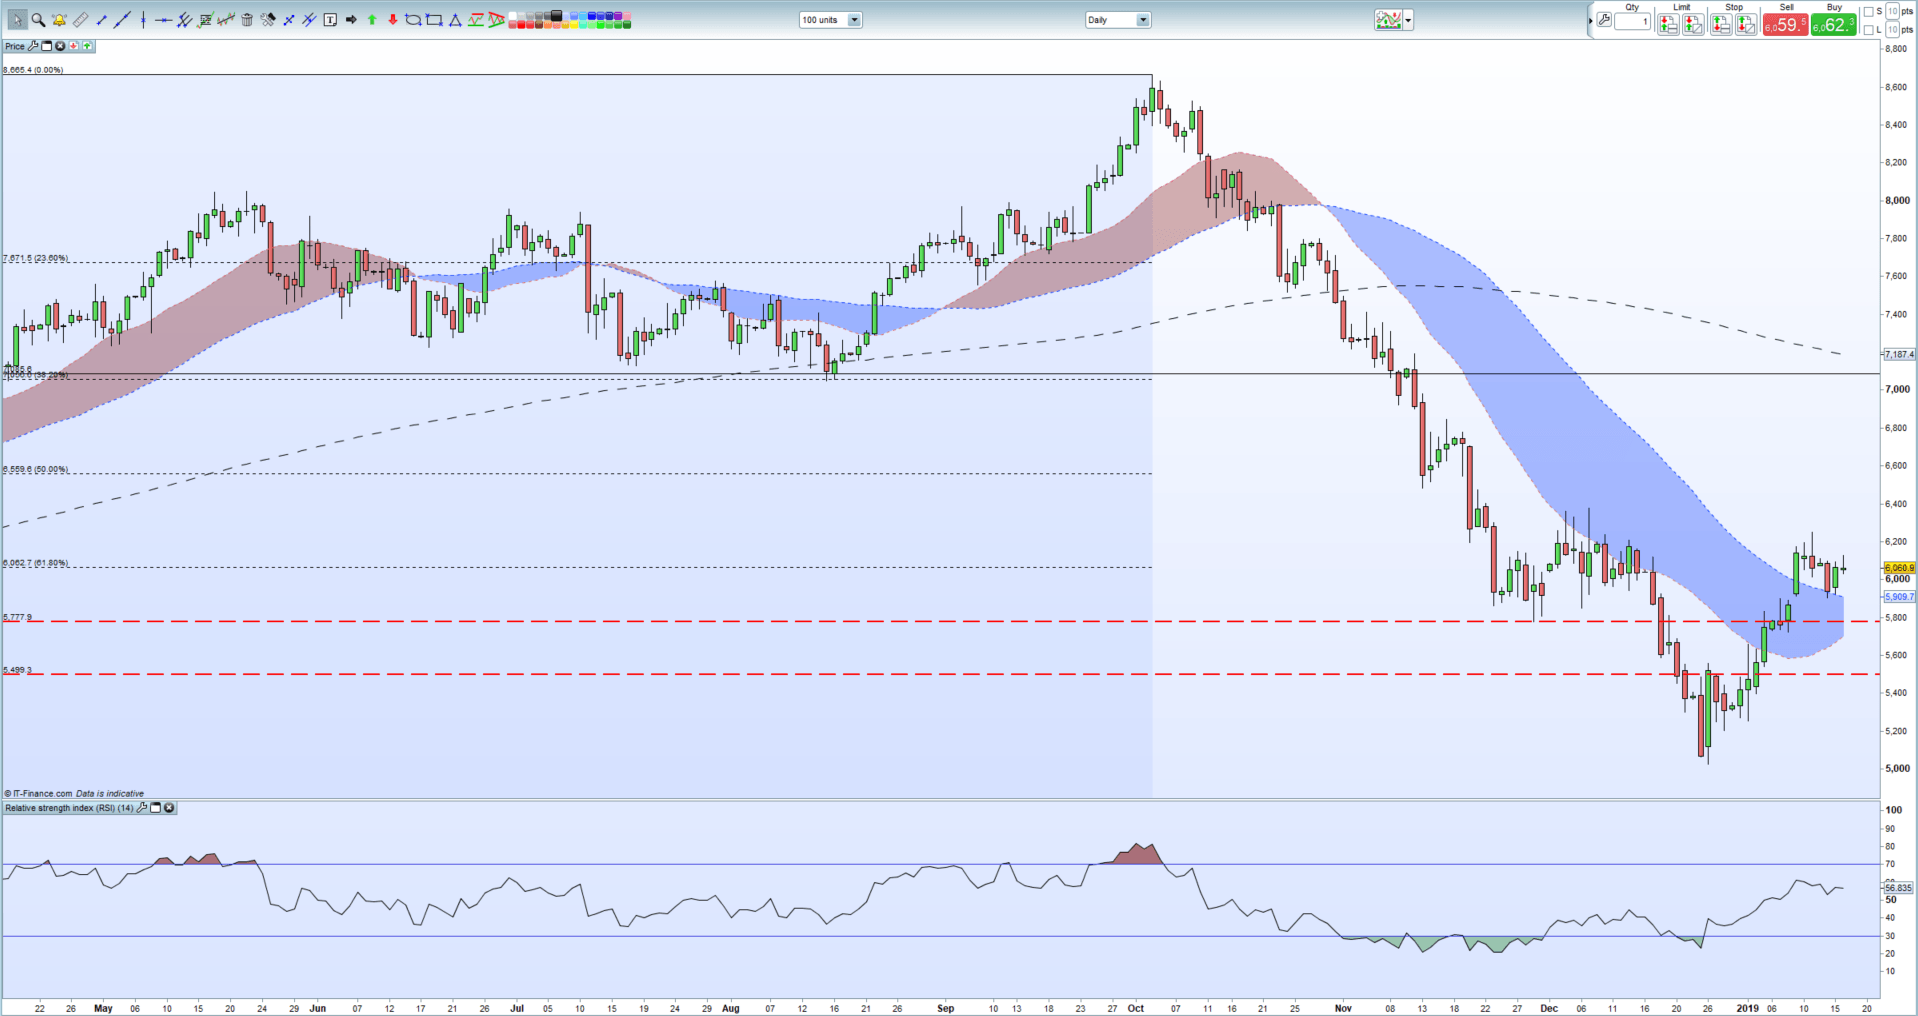
Crude continues to trade above $60/bbl. and may look to slowly grind higher as inventories decrease. The daily chart shows crude above the two shorter moving averages and trading either side of the 61.8% Fibonacci retracement of the June 2017 – October 2018 rally that saw the price of crude nearly double from $44.5/bbl. to $86.65/bbl. A 50% retracement of this move would put crude at $65.60/bbl. although the January 11 high at $62.50/bbl. would need to be broken convincingly first. According to a recent Reuters survey, Brent is expected to average $65/bbl. this year.
Brent Crude Oil Daily Price Chart (April - January 16, 2019)
WTI vs Brent – Top 5 Differences Between WTI and Brent Crude Oil
Traders may be interested in two of our trading guides – Traits of Successful Traders and Top Trading Lessons – while technical analysts are likely to be interested in our latest Elliott Wave Guide.
What is your view on Oil – bullish or bearish?? You can let us know via the form at the end of this piece or you can contact the author at nicholas.cawley@ig.com or via Twitter @nickcawley1.


