


Brent Oil and US Crude Oil Prices and Charts:
- Brent and US crude both pushing higher.
- Easing US-China trade tensions would underpin oil at current levels.
How to Trade Oil – Crude Oil Trading Strategies
Upcoming trade talks between the US and China are seen as an opportunity to tone down recent trade rhetoric between the world’s two largest economies. The ongoing spat has weighed on global growth, pushing oil sharply lower in the last few months. Recent data suggest that manufacturing activity in both the US and China has slowed down, while fears of a recession has seen the US Fed change course and pare back expectations of further interest rate hikes. US Fed Fund futures are now pricing out any interest rate hike in 2019 and are pricing in a rate cut in late 2019-early 2020.
Brent Crude Eyes Important Technical Resistance
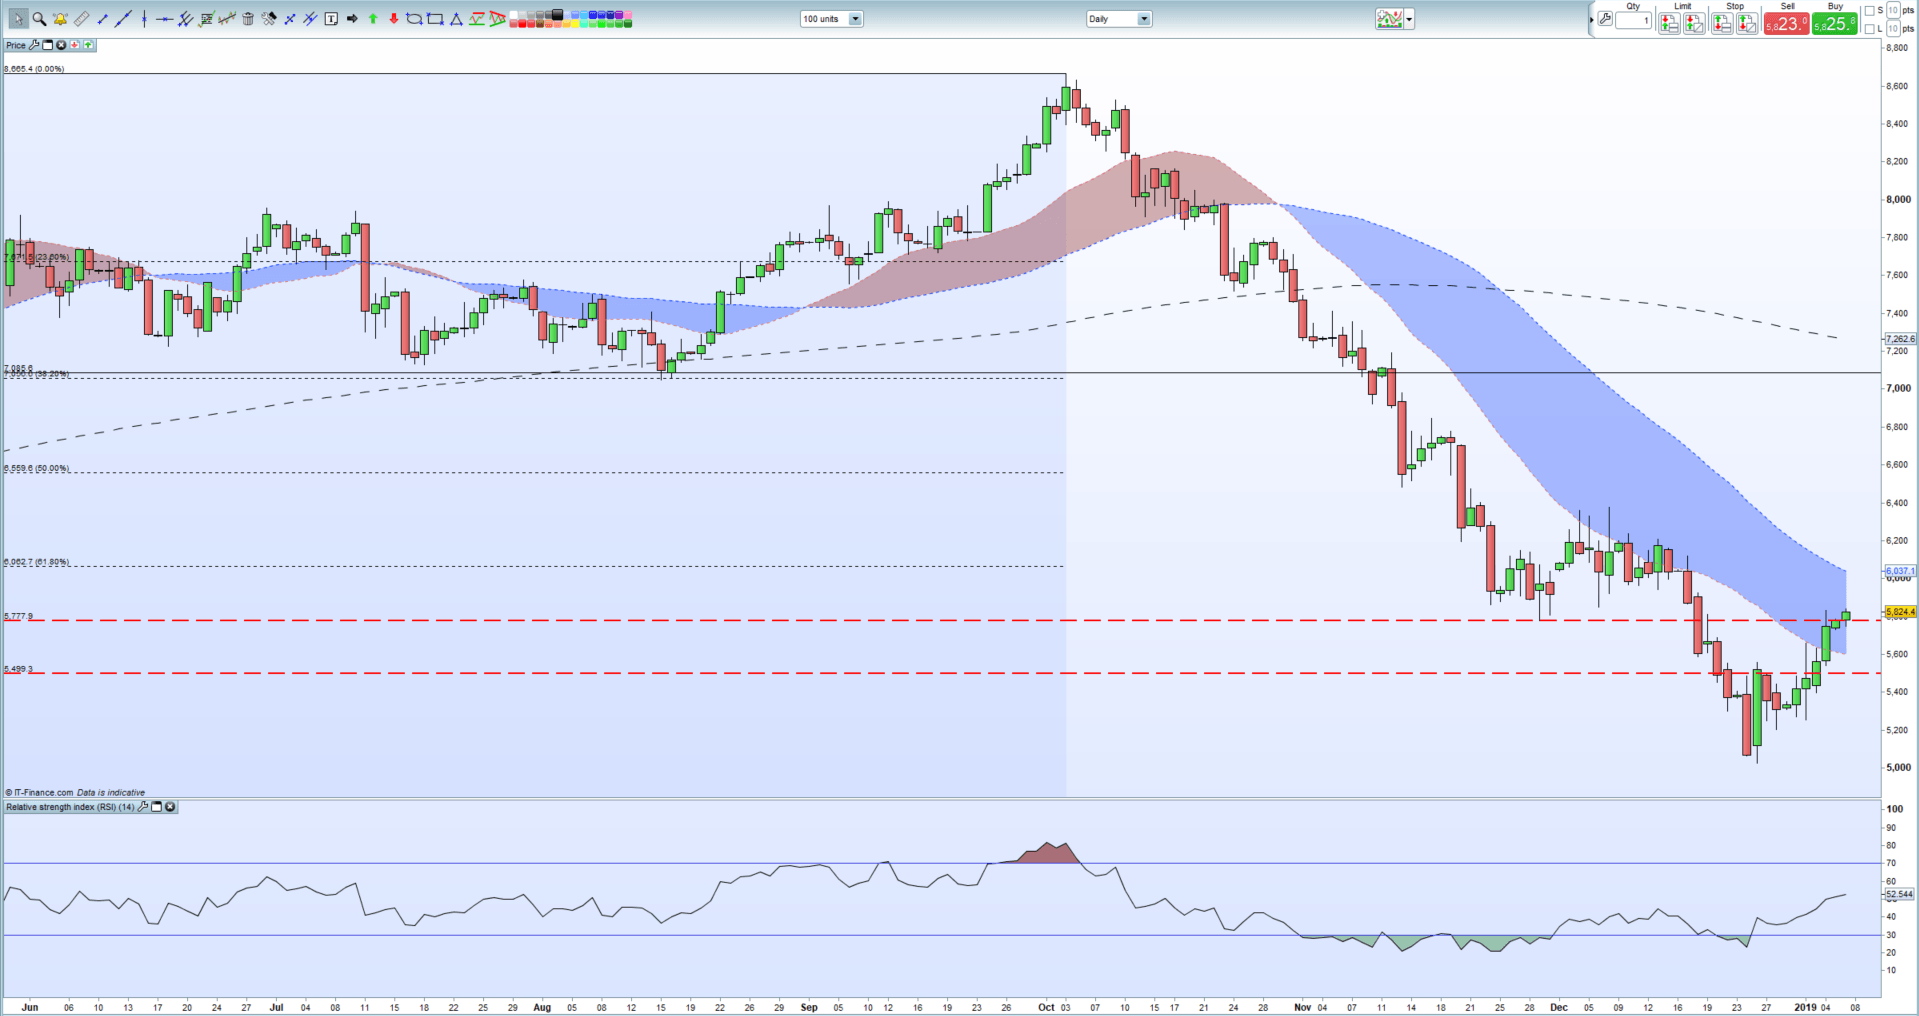
Brent Crude continues to nudge higher and is now eyeing the important 61.8% Fibonacci resistance level around $60.60/bbl. which would need to be broken and closed above to allow further upside. Also, around this area is the 50-day moving average which may also act as a brake on any further rally.
Brent Crude Oil Daily Price Chart (June 2018 - January 7, 2019)
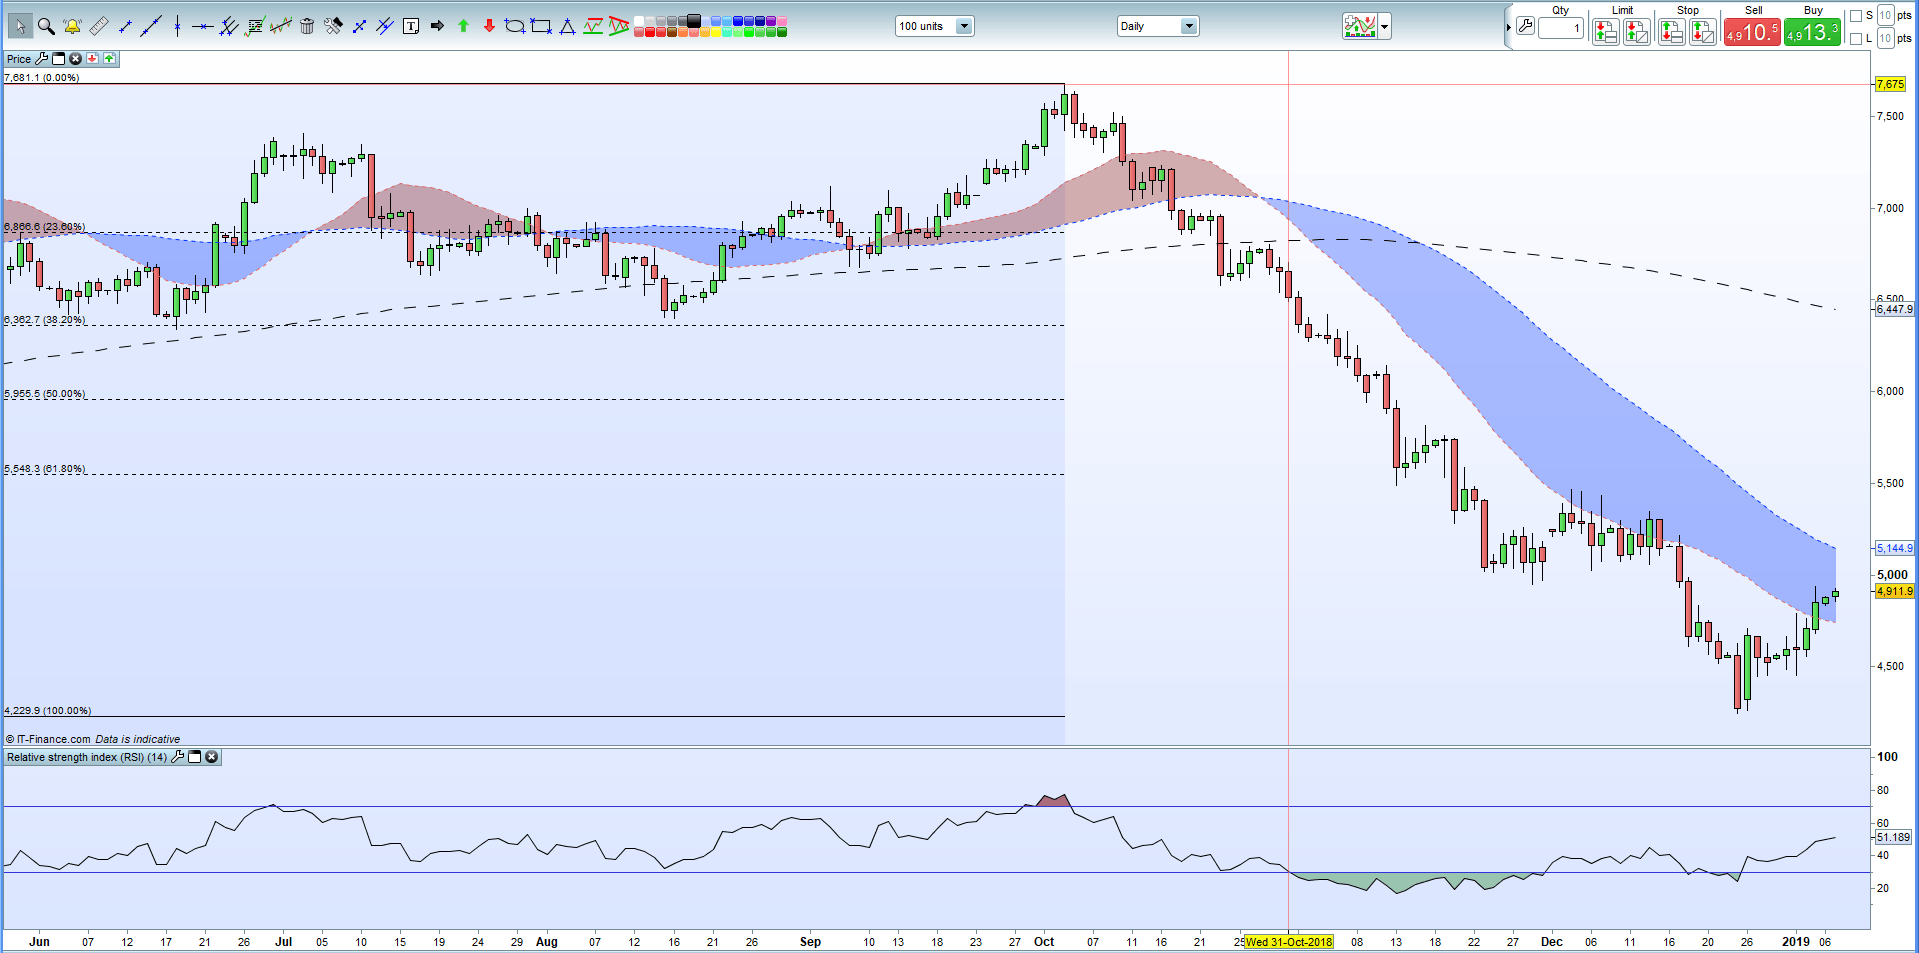
US Crude oil continues to bounce back from its recent slump lows, aided by news last week from the Federal Reserve Bank of Dallas that showed business activity in the oil space slowing sharply. The business activity index slumped to 2.3 in Q4 from 43.3 in Q3 showing activity grinding to a halt. The sharp slowdown in activity was likely caused by lower oil prices and it is likely that shale oil production may now slow down, underpinning the current price of crude.
WTI vs Brent – Top 5 Differences Between WTI and Brent Crude Oil
US Crude Oil Daily Price Chart (June 2018 - January 7, 2019)
Traders may be interested in two of our trading guides – Traits of Successful Traders and Top Trading Lessons – while technical analysts are likely to be interested in our latest Elliott Wave Guide.
What is your view on Oil – bullish or bearish?? You can let us know via the form at the end of this piece or you can contact the author at nicholas.cawley@ig.com or via Twitter @nickcawley1.


