


Asia Pacific Market Wrap – Risk Trends, China, Soybeans, Japanese Yen, ASX 200
- News of China agreeing to purchase 1.5-2M tons of soybean from US extends risk appetite
- Asia Pacific stocks rise, Shanghai Composite outperforms the most as Japanese Yen declines
- ASX 200 still a long way from a bullish reversal, all eyes on the ECB and European Council
Trade all the major global economic data live and interactive at the DailyFX Webinars. We’d love to have you along.
As anticipated, Asia Pacific benchmark stock indexes traded higher, continuing to capitalize on ebbing US China trade war fears. During Thursday’s session, reports crossed the wires that China is going to purchase around 1.5-2 million tons of US soybeans. This is one of the agreements Presidents Donald Trump and Xi Jinping talked about from last week’s G20 Leaders’ Summit, but had yet to establish a particular amount on.
Leading regional bourses higher was China as its Shanghai Composite Index rallied as much as 1.42%. Japanese ones were not too far behind with the Nikkei 225 about 1.06% higher. South Korea’s KOSPI rose roughly 0.75%. Meanwhile Australia’s ASX 200 did not fare as well as some of its counterparts, climbing only about 0.14% heading into Thursday’s close.
Taking a look at currencies, the anti-risk Japanese Yen weakened across the board as traders likely built up carry trade positions. This allowed for gains in the pro-risk Australian and New Zealand Dollars which are frequent targets in carry trades thanks to their relatively high yield. In addition, NZD/USD largely brushed aside weaker GDP estimates from New Zealand’s Treasury with the focus being on sentiment.
Ahead, all eyes will be on the ECB monetary policy announcement and the first day of the European Council meeting. The former is anticipated to end its asset purchase programme, leaving Euro and European equity traders wondering what is in store for 2019. The latter will be covering prominent political issues such as Brexit, Italian and now French budget concerns. High volatility is anticipated.
ASX 200 Technical Analysis
On the daily chart, the ASX 200 is attempting a push higher following the presence of positive RSI divergence. This signals fading downside momentum and can at times precede a turn higher. For the index to reverse its dominant downtrend since late August, a descending resistance line from November must be cleared first. Even then, the falling trend line from late August needs to be overturned thereafter.
ASX 200 Daily Chart
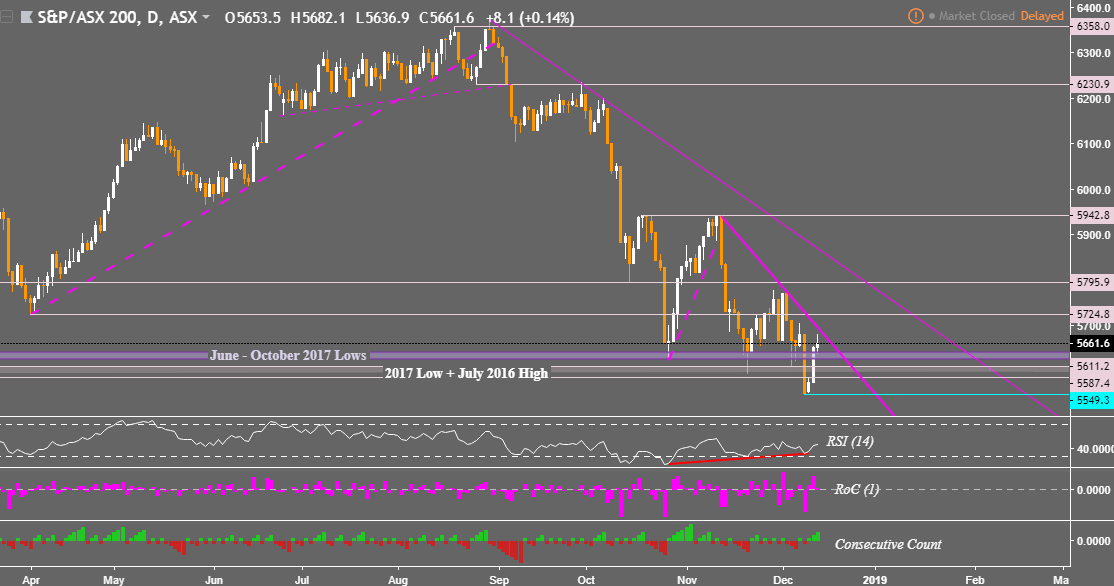
Chart created in TradingView
FX Trading Resources
- See how equities are viewed by the trading community at the DailyFX Sentiment Page
- Just getting started? See our beginners’ guide for FX traders
- Having trouble with your strategy? Here’s the #1 mistake that traders make
--- Written by Daniel Dubrovsky, Junior Currency Analyst for DailyFX.com
To contact Daniel, use the comments section below or @ddubrovskyFX on Twitter


