Talking Points:
- The Chicago Fed’s index fell to -0.15 in May from +0.42 in April, missing the forecasted +0.30
- Forty-three indicators improved in the month’s reading while forty-two declined
- Employment related indicators contributed +0.13 to the index, up from +0.12 in April
- The index’s three-month moving average decreased to +0.18 from +0.43
Stay up to date with important economic data with our Economic Calendar and gain insight on market moving events like the Chicago Fed National Activity Index from our Live Webinars.
The Chicago Fed’s National Activity Index (CFNAI) for May delivered a surprise for markets, dropping by a sharp 0.57 index points. The series declined from +0.42 in the previous month to -0.15 in May and subsequently brought its three-month moving average from +0.43 to +0.18. While forecasts suggested that growth in May could slow compared to that of April, the real figure released is a large deviation from consensus forecasts. Still, the index remains above contractionary levels, considered anything below -0.35. Similarly, month-to-month readings can be volatile so the three-month moving average can offer a more reserved picture of national activity.
The index is comprised of 85 indicators and for this month, 43 contributed positive readings while 42 deteriorated. Production-related indicators deducated –0.29 from the CFNAI in May, down from a +0.33 increase the month prior. Manufacturing industrial production decreased 0.7 percent after increasing 0.6 percent in the same time. In contrast, the sales, orders, and inventories category made a contribution of +0.05 to the report, up from a neutral contribution the previous reading. The Institute for Supply Management’s Manufacturing New Orders Index increased to 63.7 from 61.2.Employment-related indicators contributed +0.13 to the CFNAI, up slightly from +0.12. Similarly, nonfarm payrolls rose by 223,000 following April’s 159,000 addition.
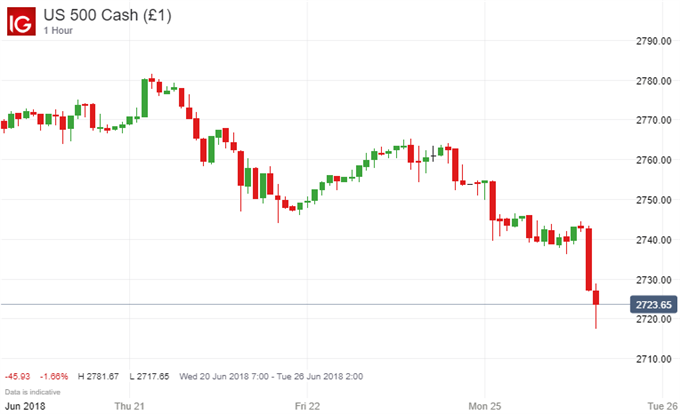
As we look to markets, part of the S&P 500’s early decline may likely be attributed to the CFNAI. As shown in the chart below, the market has rebounded slightly, climbing from intra-day lows around 2,718. The bounce could potentially be related to the data for new home sales, which delivered a surprise beat of 6.7 percent versus 0.8 percent expected and -3.2 percent in April. That said, headlines of escalated tensions between the United States and China were likely responsible for much of the market’s performance. Next month, the CFNAI reading will be important to watch as another month of decline could move the index into contractionary territory and prove that May’s reading was not a one-off. Further, the index could begin to reflect economic pain that results from the ongoing tradewars that the US has waged on allies and economic competitors alike.
Chart 1: S&P 500, Hourly June 20-25


