


Crude oil price analysis and talking points:
- An unexpected rise in US crude oil inventories and a possible increase in OPEC+ output both point to lower crude oil prices.
- From a technical viewpoint too, the price of Brent crude looks ready to slip back after reaching its highest levels since November 2014.
Check out the IG Client Sentiment data to help you trade profitably.
And for longer-term views take a look at our Q2 forecasts.
Brent crude oil price under pressure
The price of Brent crude oil, the global benchmark outside the US, has now failed twice in recent days to break convincingly above the $80 per barrel level, suggesting that the market is now toppish and ready for at least a modest move lower.
As the daily chart below shows, the price remains within a rising channel in place since mid-April but a slide towards the channel support line seems possible after those two successive failed attempts to top $80, which is seen as an important level psychologically.
Brent Crude Oil Price Chart, Daily Timeframe (Year to Date)

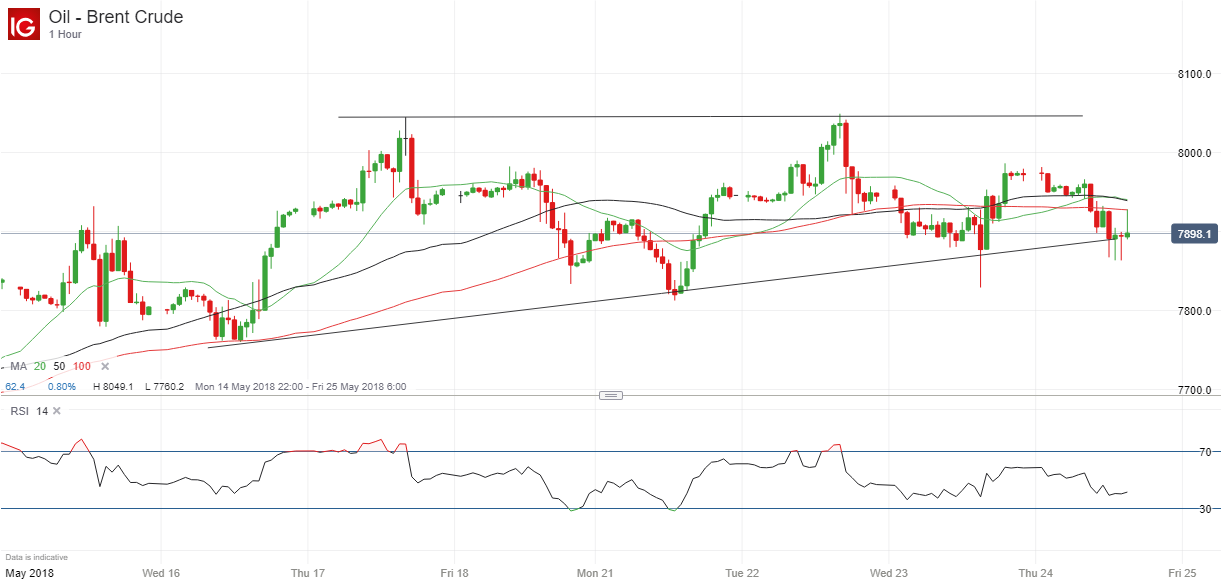
The failure just below $80.50 can be seen more clearly on the hourly chart below, where the pattern looks like a badly-formed double top. Currently, the price is sitting right on the neckline and a break under it could be the trigger that begins a drop down towards the main support line, currently at $76.45. Conversely, a climb above $80.50 would negate this bearish outlook.
Brent Crude Oil Price Chart, Hourly Timeframe (May 15 – 24, 2018)
A fall back in the price of Brent crude would be no surprise to fundamental analysts. US crude oil stockpiles are rising, with inventories climbing unexpectedly last week as net imports jumped, the US Energy Information Administration reported Wednesday. There have also been reports that members of the Organization of the Petroleum Exporting Countries along with allies such as Russia, known as OPEC+, will discuss easing their output cap at a meeting in Vienna on June 22.
However, it is also possible that supplies from both Iran and Venezuela will be disrupted by US sanctions.
Resources to help you trade the forex markets
Whether you are a new or an experienced trader, at DailyFX we have many resources to help you: analytical and educational webinars hosted several times per day, trading guides to help you improve your trading performance, and one specifically for those who are new to forex. You can learn how to trade like an expert by reading our guide to the Traits of Successful Traders.
--- Written by Martin Essex, Analyst and Editor
Feel free to contact me via the comments section below, via email at martin.essex@ig.com or on Twitter @MartinSEssex


