


Litecoin News and Talking Points
- Litecoin (LTC) chart highlights a sharp break may be on the way.
- Ripple (XRP) showed similar chart characteristics before Monday’s jump.
If you are interested in trading cryptocurrencies we have just released a new Guide to Day Trading Bitcoin and Other Cryptocurrencies to help you navigate the market.
Litecoin (LTC) Price Chart Highlights Current Indecision
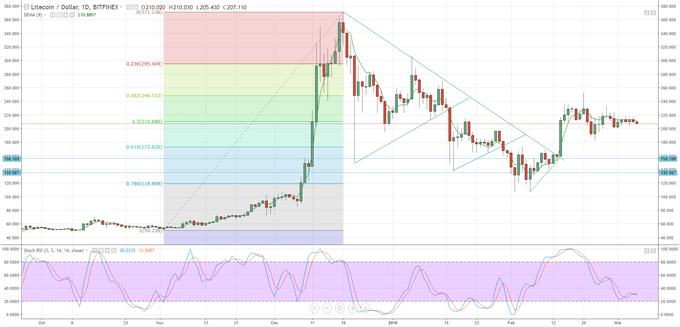
Litcoin (LTC), the fifth largest cryptocurrency by market capitalization ($11.5b) is seemingly stuck in a very tight trading range at present, trading either side of 50% Fibonacci support at $210. Price volatility is low with the small candles seen in the last two weeks highlighting market indecision, and the potential for a breakout in either direction. On the downside support at $172 should provide a strong backstop, although a break and close below opens weaker support at $150 and $132. On the upside, resistance between $232 and $237 needs to be cleared ahead of Fibonacci retracement at $248.
Ripple (XRP) Breakout May Show the Way
We looked at the Ripple’s Upside Breakout on Monday and the chart set-up looks similar to Litecoin in the last 8-10 trading sessions. Both charts are dominated by tight price action and low volatility with both digital tokens trading either side of strong support. Ripple’s breakout was preceded by heavy Asian buying interest, something not currently seen in Litecoin.
We discuss a range of cryptocurrency charts and price set-ups at our Weekly Cryptocurrency Webinar every Wednesday at 12:00 GMT.
Litecoin (LTC) Price Chart in US Dollars(September 26, 2017 – March 6, 2018)
Cryptocurrency Trader Resources
If you are interested in trading Bitcoin, Bitcoin Cash or Ethereum check out our Introduction to Bitcoin Trading Guide.
What’s your opinion on Litecoin – bullish or bearish? Share your thoughts and ideas with us using the comments section at the end of the article or you can contact me on Twitter @nickcawley1 or via email at nicholas.cawley@ig.com.
--- Written by Nick Cawley, Analyst.


