


Talking Points
- The price of crude oil dropped out of a rising channel Wednesday, suggesting further declines to come.
- A small rally Thursday has failed to negate the negative outlook.
- Check out our brand new Trading Guides: they’re free and have just been updated for the third quarter of 2017
Crude oil prices are likely to lose more ground, with both fundamental and technical factors pointing to a resumption of the recent slide. As the chart below shows, the price of the global benchmark Brent crude rose by more than $5 per barrel between June 21 and July 4, topping out only just below the $50 mark. However, it dropped sharply Wednesday and has made only a modest recovery so far Thursday.
Chart: Brent Crude Daily Timeframe (March 2017 to Date)
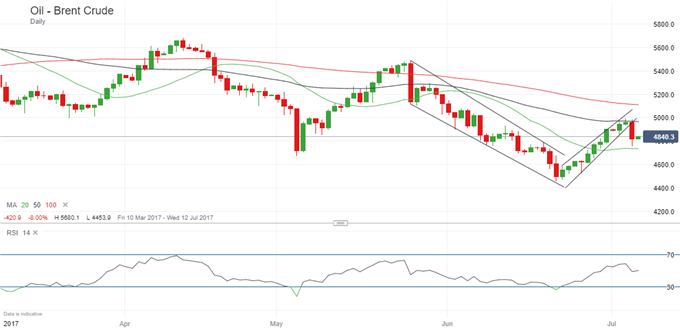
The breakout from the rising channel the price traded in for 11 sessions leaves the previous support line as resistance, currently close to $50. By contrast, once the price drops below the 20-day moving average – the green line on the chart – there is little obvious support until the June 21 low at $44.54. Moreover, as the relative strength indicator at the bottom of the chart shows, the commodity has not yet been oversold.
This technical picture is backed by fundamental factors. American Petroleum Institute data released Wednesday showed US crude inventories fell by 5.8 million barrels in the week to June 30 to 503.7 million, compared with analysts' expectations for a decrease of 2.3 million barrels. Crude stocks at the Cushing, Oklahoma, delivery hub fell by 1.4 million barrels, API said.
However, prices rallied only mildly after the figures. It will take more than one such report to bring back the previous bullish sentiment, and steady declines in inventories are needed if prices are to recover against a backdrop of rising OPEC exports and increasing output from several key producers. This session brings the official US crude inventories figure from the Energy Information Administration and if they decline by less than the expected 2.0 million barrels that will add further downward pressure on crude prices.
Meanwhile, IG Client Sentiment data currently show little bias one way or the other. Traders are net-long US crude oil, suggesting prices may continue to fall as we take a contrarian view of crowd sentiment. Moreover, positioning is more net-long than yesterday. However, it is less net-long than last week and the combination of current sentiment and recent changes paints a mixed picture overall.
--- Written by Martin Essex, Analyst and Editor
To contact Martin, email him at martin.essex@ig.com
Follow Martin on Twitter @MartinSEssex
Take a look at the DailyFX Economic Calendar, and see what live coverage of key event risk impacting FX markets is scheduled for the week on the DailyFX Webinar Calendar


