USD PRICE OUTLOOK: US DOLLAR OSCILLATIONS YIELDS DXY INDEX TRADING RANGE
- USD price action continues to gyrate within the confines of two major technical barriers
- The US Dollar and DXY Index could remain broadly rangebound as markets drift sideways
- US Dollar bears still seem in control but surging Treasury yields might support the USD
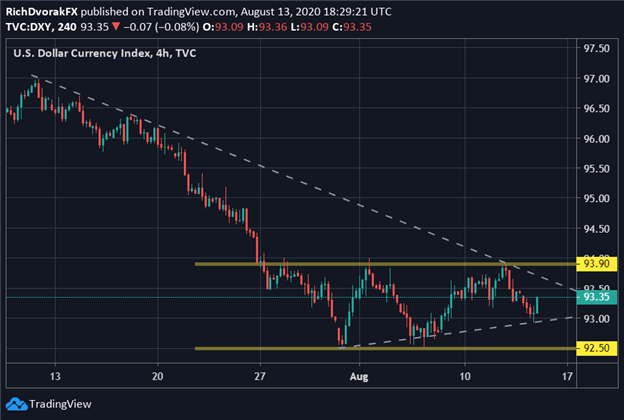
USD price action has been fairly active over recent trading sessions as indicated by measures of realized currency volatility. It appears that the US Dollar largely lacks direction, however, judging by the horizontal trend under development. This corresponds with the DXY Index ping-ponging back and forth between key technical support and resistance levels.
DXY INDEX – US DOLLAR PRICE CHART: 4-HOUR TIME FRAME (08 JUL TO 13 AUG 2020)

The broad US Dollar Index is currently fluctuating near the mid-point of its trading range formed since 27 July. This broad trading range is approximately defined by the 92.50 and 93.90 price levels, which will look to serve as technical barriers with potential of keeping USD price action relatively contained moving forward. The US Dollar also seems to be coiling between a short-term rising trendline set to clash with a falling medium-term trendline.
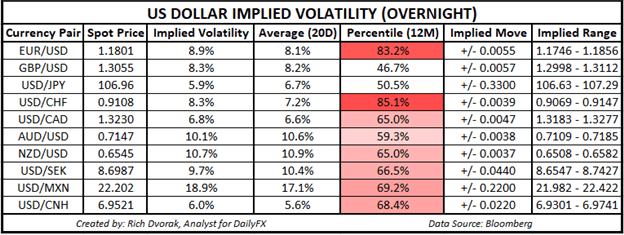
USD PRICE OUTLOOK – US DOLLAR IMPLIED VOLATILITY TRADING RANGES (OVERNIGHT)

Placing focus on potential fundamental catalysts that may carry enough credence to weigh materially on the US Dollar’s direction brings our attention to the DailyFX Economic Calendar. High-impact event risk is scheduled for Friday’s trading session with monthly data releases expected on US retail sales and consumer sentiment. Another possible driver of USD price action may include surging Treasury yields.
Keep Reading: EUR/USD Builds a Range – Chart Levels Eyed
-- Written by Rich Dvorak, Analyst for DailyFX.com
Connect with @RichDvorakFX on Twitter for real-time market insight


