


EUR/USD PRICE OUTLOOK: EURO TO US DOLLAR BUILDS TRADING RANGE – LEVELS TO WATCH
- EUR/USD price action has drifted lower and now gravitates below its 8-day moving average
- Euro strength wanes as the bloc currency gives back recent gains against its US Dollar peer
- EUR/USD could develop a trading range roughly between the 1.1700-1.1900 price levels
EUR/USD price action has fluctuated within a broad 200-pip trading range after the major currency pair topped out at the 1.19-handle. The Euro still trades considerably higher relative to its US Dollar counterpart, currently up about 10% since EUR/USD based around the 1.08-price level three months ago, but the bloc currency has started to surrender some of those gains.

EUR/USD PRICE CHART: DAILY TIME FRAME (01 MAY TO 11 AUGUST 2020)

As Euro strength starts to ebb, which is indicated by the falling relative strength index, it seems that EUR/USD bulls are losing conviction. This follows a potential double top pattern at the 1.1900-mark. Spot EUR/USD price action now hovers below its downward-sloping 8-day moving average.
| Change in | Longs | Shorts | OI |
| Daily | -10% | -4% | -8% |
| Weekly | -13% | 35% | 0% |
This technical barrier could suggest a bearish bias may be developing as the short-term trend starts to point lower. That said, interim technical support appears to align with month-to-date lows residing roughly around the 1.1700-handle before the medium-term 34-day moving average comes into focus as a potential downside target for EUR/USD bears.
EUR/USD PRICE CHART: 4-HOUR TIME FRAME (29 APRIL TO 11 AUGUST 2020)
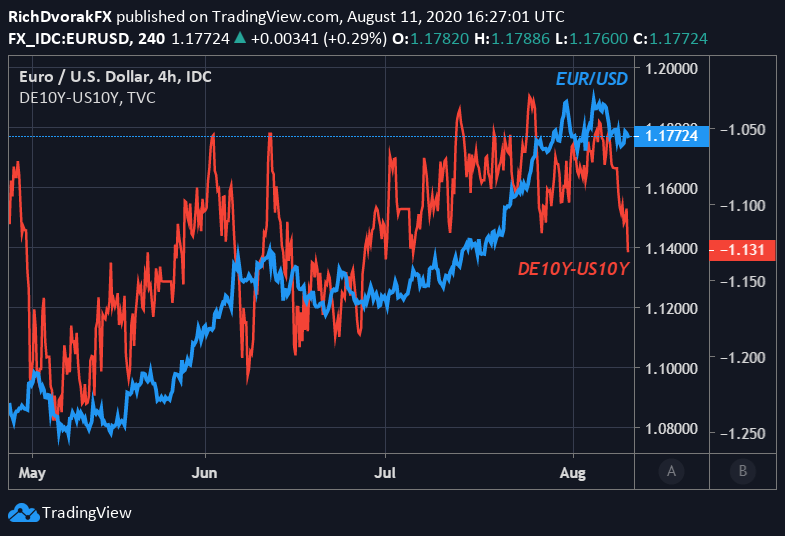
Chart created by @RichDvorakFX with TradingView
Another headwind potentially threatening the recent EUR/USD rally is the latest collapse in sovereign yield spreads between 10-year US Treasuries and German Bunds. This widening interest rate differential could provide a boost to the US Dollar relative to its lower-yielding Euro peer, particularly if the move higher in Treasury yields can gain traction.
-- Written by Rich Dvorak, Analyst for DailyFX.com
Connect with @RichDvorakFX on Twitter for real-time market insight


