US DOLLAR PRICE OUTLOOK: EUR/USD & GBP/USD RALLY HARD AS USD/CAD CRUMBLES, DXY INDEX EYES TECHNICAL SUPPORT
- US Dollar extends lower with USD price action remaining under pressure
- DXY Index has dropped nearly 1% month-to-date as EUR, GBP, and CAD rally
- The US Dollar looks toward technical support to stymie its slide as volatility ebbs
USD price action is getting hammered lower yet again and weighing down the broader US Dollar. Largely driven by EUR/USD and GBP/USD rallying hard, and USD/CAD dropping considerably, the DXY Index is on pace to slide over 0.5% for Wednesday’s trading session.
| Change in | Longs | Shorts | OI |
| Daily | -13% | 8% | -4% |
| Weekly | -19% | 46% | 2% |
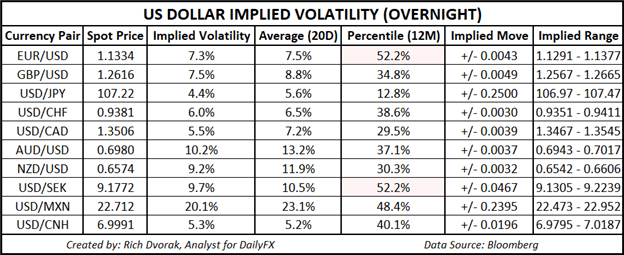
Fueled primarily by fading demand for safe-haven assets, the US Dollar trades nearly 1.0% lower month-to-date on balance as USD weakness resonates across major currency pairs. US Dollar downside also seems to have tracked a natural retracement lower by VIX Index ‘fear-gauge’ and measures of implied currency volatility.
USD PRICE OUTLOOK – US DOLLAR IMPLIED VOLATILITY TRADING RANGES (OVERNIGHT)

That said, subdued levels of expected market activity (i.e. implied volatility) relative to readings observed earlier this year, particularly if the trend continues lower, might facilitate sustained headwinds for USD price action. On the contrary, trader sentiment, which appears in a prevailing state of euphoria, could quickly sour if catalyzed by a destabilizing fundamental catalyst.


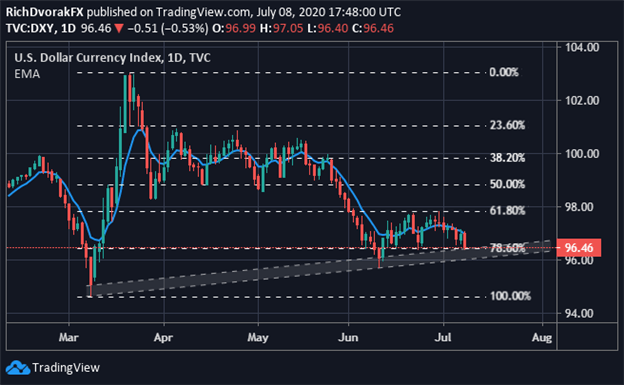
Also noteworthy, the US Dollar’s stretch lower to start the month has pressured the DXY Index toward key technical barriers that might provide support to the Greenback. For instance, spot GBP/USD price action is flirting with technical resistance posed by its 1-week options implied trading range outlined in this US Dollar outlook published on Monday, which could keep further advances by the Pound-Dollar at bay. GBP/USD is the third largest component of the DXY Index behind the Euro and the Yen.
DXY INDEX – US DOLLAR PRICE CHART: DAILY TIME FRAME (11 FEB TO 08 JUL 2020)

Chart created by @RichDvorakFX with TradingView
Furthermore, the US Dollar Index is currently probing its broader bullish trend support line extended through the 09 March and 10 June swing lows. This area of technical confluence is also underpinned by the 78.6% Fibonacci retracement of its year-to-date trading range. Although, the negatively sloped 8-day exponential moving average indicates the short-term direction is trending lower.
Keep Reading – GBP/USD Price Outlook: Pound-Dollar Tops 200-EMA as Sterling Soars
-- Written by Rich Dvorak, Analyst for DailyFX.com
Connect with @RichDvorakFX on Twitter for real-time market insight


