


US DOLLAR DOWN WITH EXPECTED STOCK MARKET VOLATILITY AS WALL STREET TAKES CUE FROM CHINESE EQUITIES
- US Dollar spikes lower led by a breakdown in USD/CNH price action as China stocks surge
- S&P 500 VIX Index plummets as expected stock market volatility evaporates
- DXY Index could remain under pressure as investor complacency runs rampant
The US Dollar is trading on its back foot largely due to another strong start to the week from global equities. An upbeat tone was echoed by the China A50 stock market index, which exploded over 5% on Monday and rocketed past double-top resistance dating back to 2015.
Investors on Wall Street have followed suit from Chinese equities by pushing the S&P 500, Nasdaq and Dow Jones higher by about 1.5% each. Meanwhile, this has crushed the VIX Index ‘fear-gauge’ lower and delivered a bearish blow to the US Dollar.

US DOLLAR & VIX INDEX PRICE CHART: DAILY TIME FRAME (APRIL 2019 TO JULY 2020)
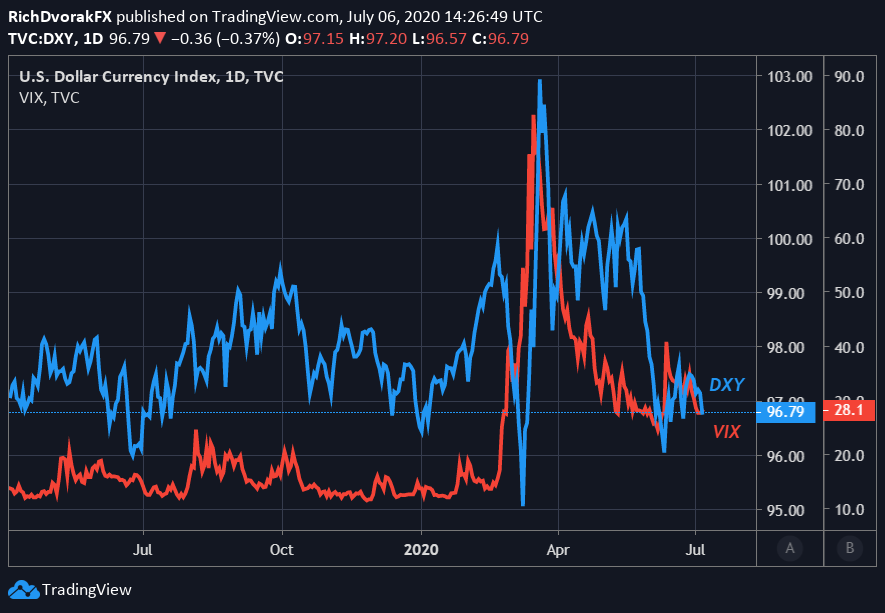
Chart created by @RichDvorakFX with TradingView
As illustrated in the chart above, there is generally a positive relationship held between the VIX and the broader US Dollar. The VIX Index tends to rise during episodes of risk-aversion as investors hedge against downside risk while the US Dollar is generally supported by its status as a top safe-haven asset.
USD PRICE OUTLOOK – US DOLLAR IMPLIED VOLATILITY & TRADING RANGES (1-WEEK)

Measures of expected currency volatility have declined as well. This is indicated by 1-week USD implied volatility readings just clocked across major currency pairs and top US Dollar FX crosses detailed in the table above. That said, several fundamental drivers threaten to destabilize the seemingly euphoric risk rally and stymie potential US Dollar downside.

On that note, June 2020 jobs data revealed that the number of permanent job losses continued to rise as those filing for unemployment insurance eclipsed 31-million Americans. New coronavirus cases keep climbing as the pandemic persists, pushing local governments and private companies to backtrack on reopening guidelines. Also, the Federal Reserve balance sheet has contracted for the last three consecutive weeks as US Dollar swaps roll off.

This reduced supply of US Dollars circulating the financial system stands to provide a bullish tailwind to USD price action. Correspondingly, the US dollar might maintain a broad trading range as conflicting fundamental drivers keep the Greenback relatively contained. Options-implied trading ranges are calculated using 1-standard deviation (i.e. 68% statistical probability price action is contained within the implied trading range over the specified time frame). Check out this article on how to trade the top 10 most volatile currency pairs for additional insight.
Keep Reading – Stock Market Outlook: Dow Eyes China Tension & Dollar-Yuan
-- Written by Rich Dvorak, Analyst for DailyFX.com
Connect with @RichDvorakFX on Twitter for real-time market insight


