
US DOLLAR FORECAST: DXY INDEX SEARCHES FOR SUPPORT, AUD/USD RUNS OUT OF STEAM, GBP/USD PROBES RESISTANCE
- The US Dollar, measured via the DXY Index, stabilizes into month and quarter end following a flareup in FX volatility amid the coronavirus pandemic
- AUD/USD finds resistance around the 0.6200 price level after rebounding nearly 10% off its recent swing low as the recovery in risk appetite pauses
- GBP/USD prices start to consolidate as the Pound-Dollar struggles to eclipse the 1.2500 handle despite massive FOMC intervention
Judging by performance of the DXY Index, a popularly cited basket of major currency pairs, the US Dollar has slipped about 4% from its year-to-date high recorded just two weeks ago. Despite the recent stretch of weakness, which likely follows a retracement in FX volatility and risk aversion, the broader US Dollar gained roughly 1% this month on balance.
DXY INDEX PRICE CHART: 4-HOUR TIME FRAME (28 FEBRUARY T0 31 MARCH 2020)
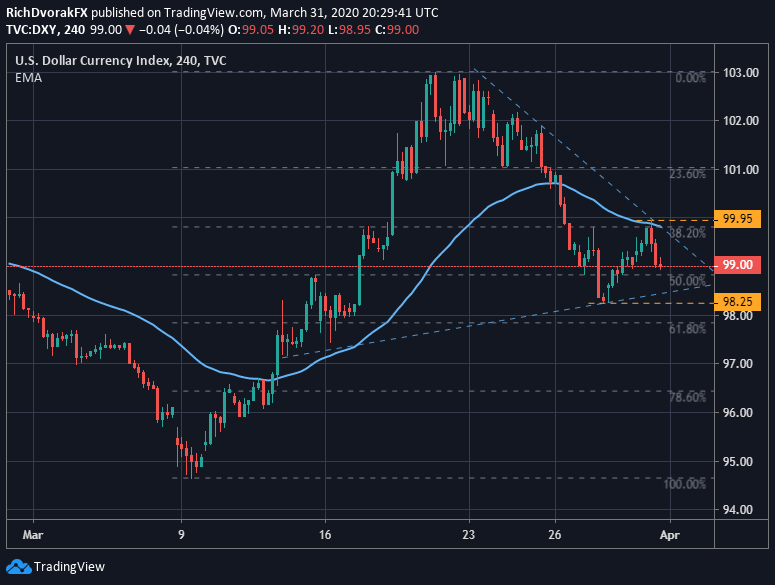
Chart created by @RichDvorakFX with TradingView
I noted on March 20 how it seemed like the surging US Dollar hit a wall of technical resistance after the DXY Index found pushback at the 103.00 price. Now, the broader US Dollar Index is fluctuating around the 99.00 handle, which just so happens to align with the mid-point of its monthly trading range.
As currency volatility recedes and market sentiment improves, largely facilitated by Fed and fiscal stimulus optimism, the US Dollar might face further downward pressure owing to the drop-off in demand for anti-risk assets – such as the Greenback.

Nevertheless, considering a coronavirus-induced recession is likely unavoidable, the DXY Index could quickly recoil toward multi-year highs as traders flock back into safe-haven currencies, perhaps driven by the return in risk-aversion, once economic reality sinks in.
AUD/USD PRICE CHART: 4-HOUR TIME FRAME (28 FEBRUARY T0 31 MARCH 2020)
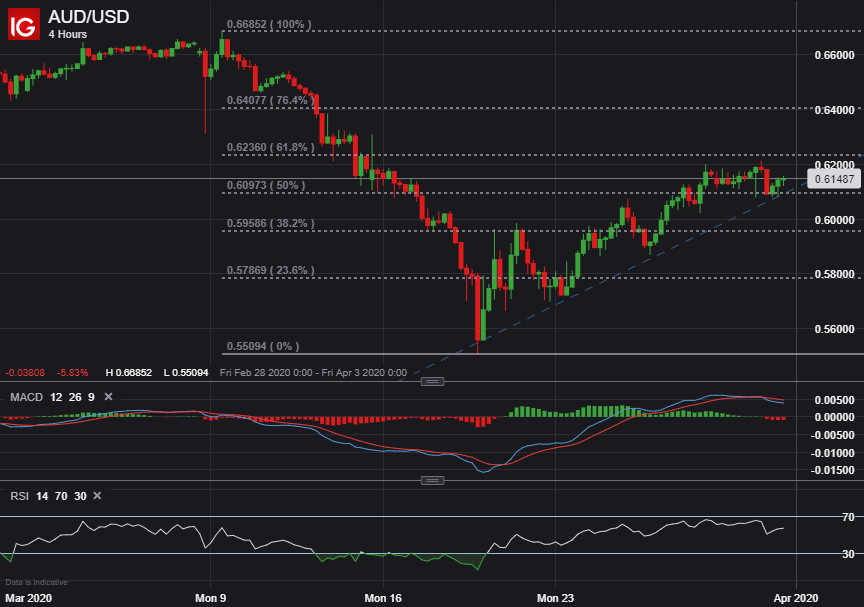
AUD/USD has rebounded considerably after the Aussie notched a fresh 17-year low against its US Dollar peer earlier this month. Going forward, the short-term trendline of support, extended through the series of higher lows printed since March 19, has potential to keep bolstering spot AUD/USD price action. Although, the 0.6200 price zone stands out as an apparent technical barrier that could thwart further upside in AUD/USD.

GBP/USD PRICE CHART: DAILY TIME FRAME (29 NOVEMBER 2019 TO 31 MARCH 2020)
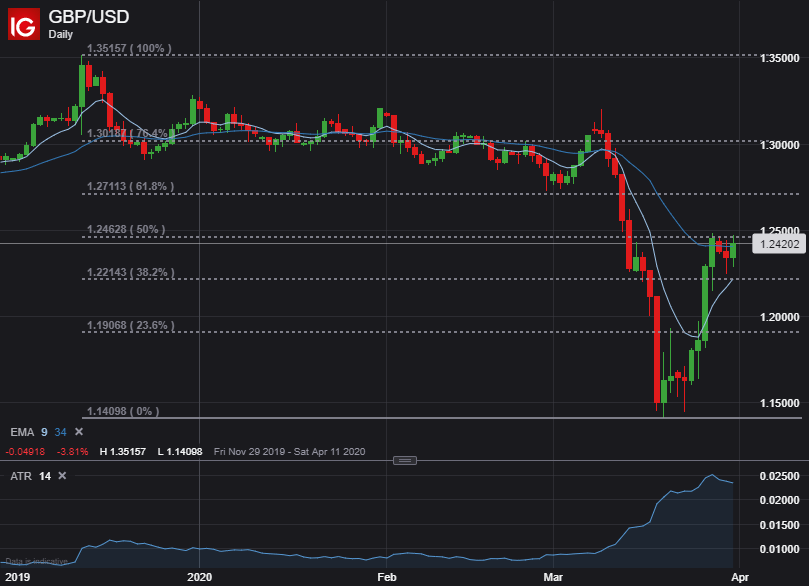
The Pound Sterling has also recovered notably relative to its US Dollar counterpart since GBP/USD broke down to its lowest reading on record – even below the Brexit bottom – earlier this month. In fact, GBP/USD has clawed back about 1,000-pips of recent downside since its all-time low printed merely two weeks ago. However, spot GBP/USD price action now tests technical resistance posed by confluence near the 1.2500 handle and 34-day exponential moving average.
| Change in | Longs | Shorts | OI |
| Daily | 25% | -16% | 6% |
| Weekly | 18% | -9% | 6% |
Failing to eclipse last week’s high, a breach of the 9-day EMA, could suggest GBP/USD bulls have lost impetus and that a return of US Dollar dominance may lurk on the horizon. That said, a barrage of high-impact US data releases on tap later this week, which are detailed on the DailyFX Economic Calendar, could strongarm the direction of the DXY Index and broader USD price action.
Read More – USD/MXN: US Dollar to Mexican Peso Resumes Surge as Oil Plunges
-- Written by Rich Dvorak, Junior Analyst for DailyFX.com
Connect with @RichDvorakFX on Twitter for real-time market insight