


Gold Price Talking Points
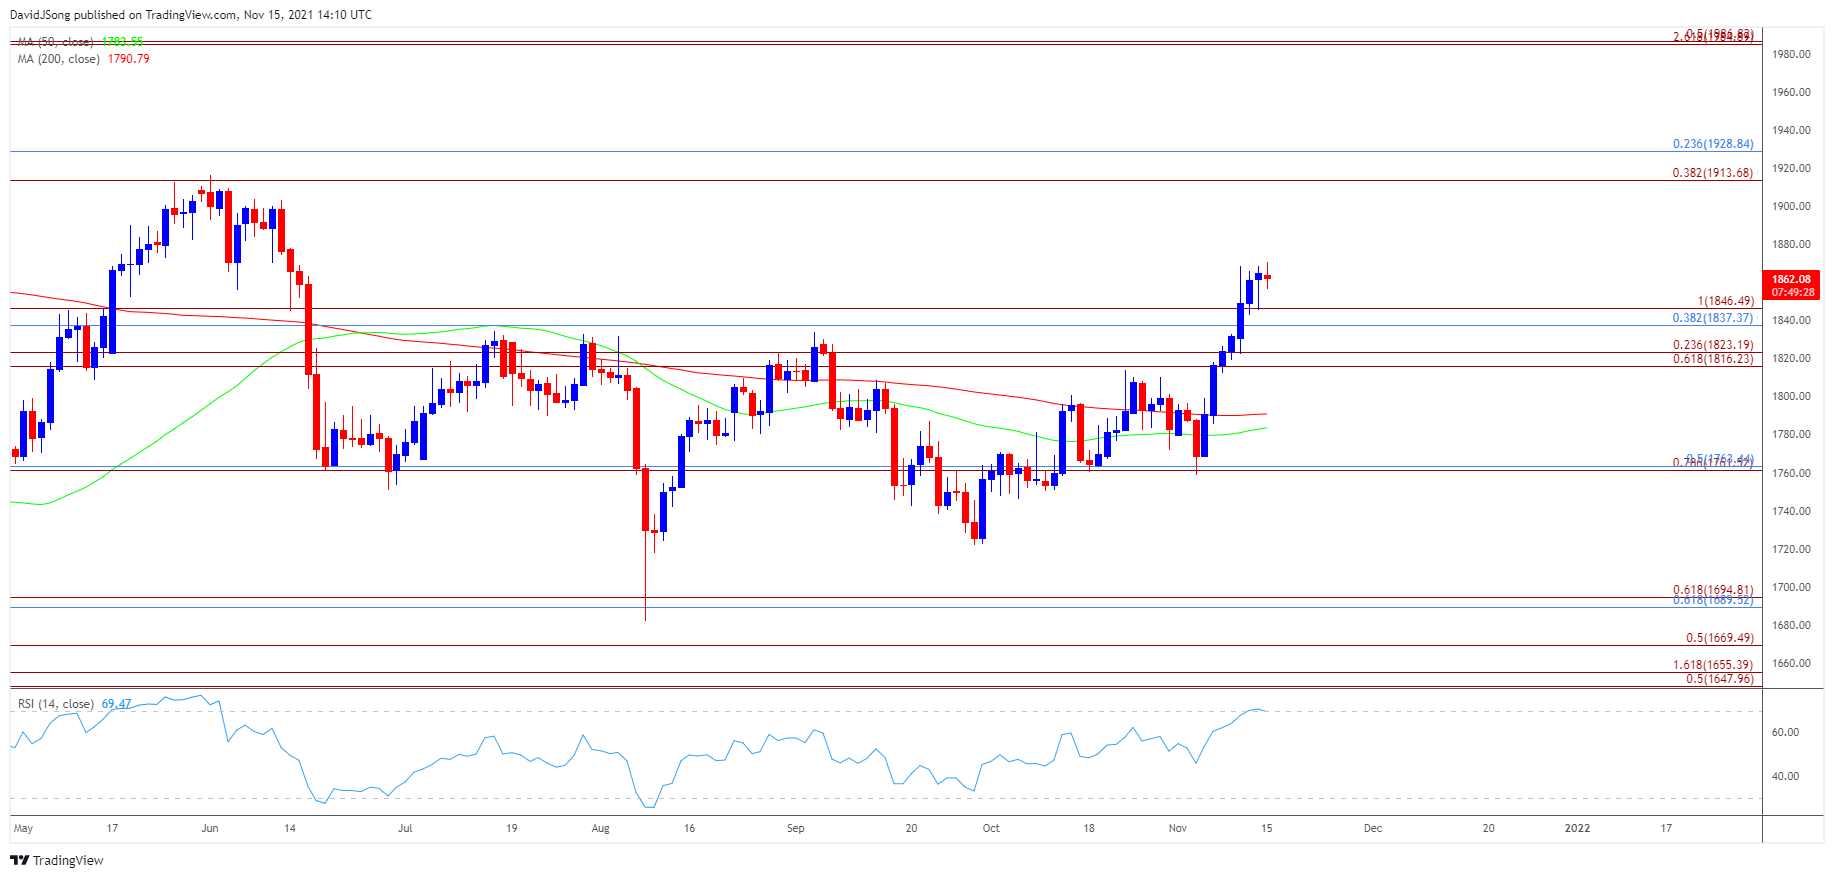
The price of gold attempts to stage an eight day rally for the first time since July 2020 as it trades to a fresh monthly high ($1871), and recent developments in the Relative Strength Index (RSI) raises the scope for higher gold prices as the indicator climbs above 70 to push into overbought territory.
Gold Price Stages Eight Day Rally as RSI Climbs Into Overbought Zone
The price of gold extends the advance from earlier this month after taking out the September high ($1834), and the bullish momentum may gather pace as long as the RSI holds in overbought territory.
Keep in mind, the RSI held above 70 for just over two weeks when the price of gold touched a high of $1917 in June, and a similar scenario may materialize over the remainder of the month as the larger-than-expected uptick in the US Consumer Price Index (CPI) spurs a near-term breakout in bullion.

It remains to be seen if the Federal Reserve will respond to the stickiness in inflation as the central bank is slated to update the Summary of Economic Projections (SEP) as its last meeting for 2021, but signs of stronger economic activity may keep Chairman Jerome Powell and Co. on their current path as Retail Sales are expected to increase 1.1% in October after climbing 0.7% the month prior.
In turn, the Federal Open Market Committee (FOMC) may stay on track to “reduce the monthly pace of our net asset purchases by $10 billion for Treasury securities and $5 billion for agency mortgage-backed securities” in 2022, and current market conditions may keep the price of gold afloat as longer-dated US Treasury yields struggle to retrace the decline from earlier this year.
With that said, the price of gold may continue to retrace the decline from the June high ($1917) ahead of the next FOMC rate decision on December 15 as the central bank carries out a gradual approach in removing monetary stimulus, and recent developments in the Relative Strength Index (RSI) raises the scope for higher gold prices as it climbs above 70 to push into overbought territory.
Gold Price Daily Chart
Source: Trading View
- Keep in mind, the negative slope in the 200-Day SMA ($1791) indicates that the broader trend for the price of gold remains tilted to the downside, with a ‘death cross’ formation taking shape in August as the Relative Strength Index (RSI) pushed into oversold territory.
- However, lack of momentum to test the March low ($1677) generated a textbook RSI buy signal as the oscillator climbed back above 30, with the recent breakout in the price of gold pushing the indicator into overbought territory for the first time since July 2020.
- The price of gold trades above the Fibonacci overlap around $1837 (38.2% retracement) to $1847 (100% expansion) after clearing the September high ($1834), with the $1914 (38.2% expansion) to $1929 (23.6% retracement) region on the radar as it lines up with the June high ($1917).

--- Written by David Song, Currency Strategist
Follow me on Twitter at @DavidJSong


