


Japanese Yen Talking Points
USD/JPY continues to consolidate within a bull flag formation as longer-dated US Treasury yields remain under pressure, but the Federal Reserve interest rate decision is likely to influence the exchange rate as the central bank appears to be on track to scale back monetary support.
USD/JPY Trades in Bull Flag Formation Ahead of FOMC Rate Decision
USD/JPY trades within a narrow range as the Federal Open Market Committee (FOMC) is expected keep the benchmark interest rate at the record low, and it remains to be seen if the central bank will taper its purchases of Treasury securities and mortgage-backed securities (MBS) amid expectations for a pickup in economic activity.
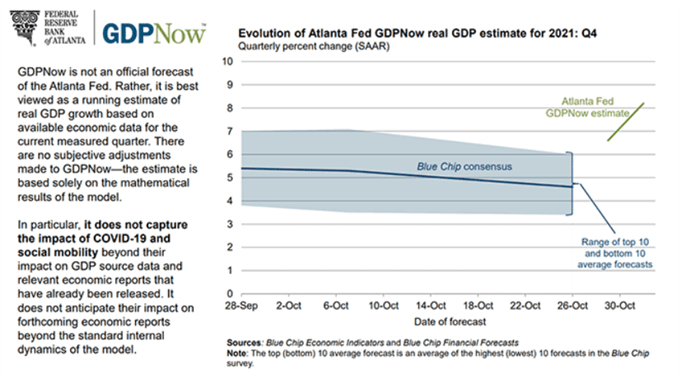
According to the Atlanta Fed, “the GDPNow model estimate for real GDP growth (seasonally adjusted annual rate) in the fourth quarter of 2021 is 8.2 percent on November 1, up from 6.6 percent on October 29,” and forecasts for a marked rise in the growth rate may encourage Chairman Jerome Powell and Co. to scale back monetary support as minutes from the September meeting emphasize that “the labor market had continued to show improvement since the Committee's previous meeting.”
As a result, USD/JPY may attempt to break out of the bull flag formation if the Fed starts to scale back monetary support, and the exchange rate may exhibit a bullish trend throughout the remainder of the year as the Bank of Japan (BoJ) sticks to its Quantitative and Qualitative Easing (QQE) program with Yield-Curve Control (YCC).
In turn, the pullback from the October high (114.70) may turn out to be a correction in the broader trend as speculation for a change in regime lifts US yields, but a further decline in USD/JPY may continue to alleviate the tilt in retail sentiment like the behavior seen earlier this year.
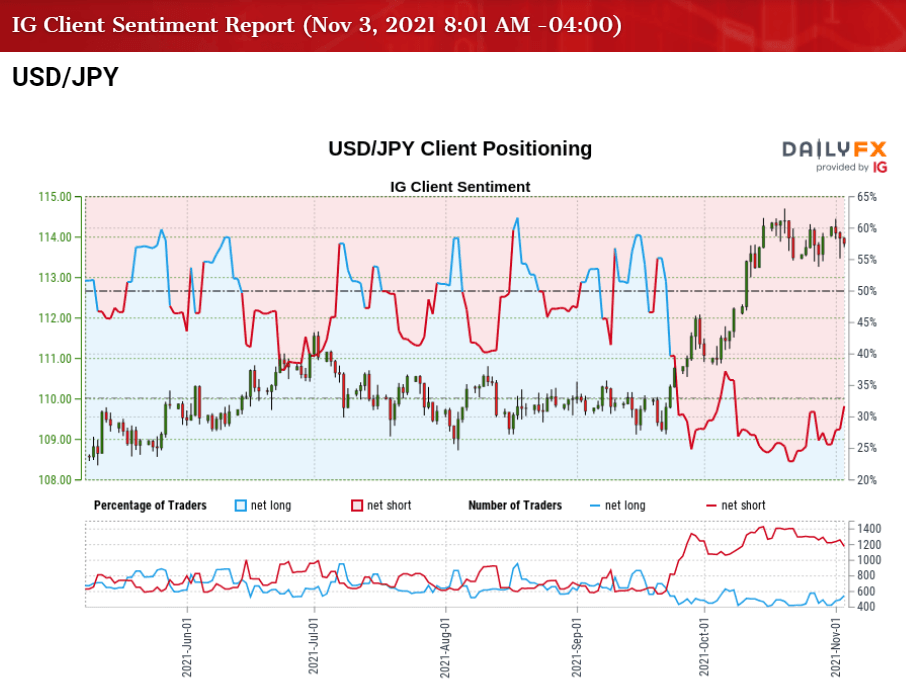
The IG Client Sentiment report shows 31.15% of traders are currently net-long USD/JPY, with the ratio of traders short to long standing at 2.21 to 1.
The number of traders net-long is 3.40% higher than yesterday and 15.16% higher from last week, while the number of traders net-short is 3.87% higher than yesterday and 2.58% lower from last week. The rise in net-long interest has helped to alleviate the tilt in retail sentiment as 27.68% of traders were net-long USD/JPY last week, while the decline in net-short interest comes as the exchange rate trades in a narrow range.
With that said, the deviating paths between the FOMC and BoJ may keep USD/JPY afloat throughout the remainder of the year, but a delay in the Fed’s exit strategy may produce headwinds for the Dollar ahead of the US Non-Farm Payrolls (NFP) report on tap for later this week as market participants push out bets for higher interest rates.

USD/JPY Rate Daily Chart

Source: Trading View
- The broader outlook for USD/JPY remains constructive as it trades to fresh yearly highs in the second half of 2021, with the 200-Day SMA (109.56) indicating a similar dynamic as it retains the positive slope from earlier this year.
- The Relative Strength Index (RSI) showed a similar dynamic as it pushed into overbought territory for the first time since the first quarter of 2021, but a textbook sell signal materialized in October as the oscillator fell back from overbought territory to slip below 70.
- Nevertheless, the pullback from the October high (114.70) may turn out to be a correction in the broader trend as USD/JPY appears to be trading within a bull flag formation, but need a break/close above the Fibonacci overlap around 113.80 (23.6% expansion) to 114.30 (23.6% retracement) to bring the November 2017 high (114.74) on the radar.
- Next area of interest comes in around 115.90 (100% expansion) to 116.10 (78/6% expansion) followed by the overlap around 117.60 (23.6% retracement) to 117.90 (23.6% retracement).
- However, lack of momentum to push back above the overlap around 113.80 (23.6% expansion) to 114.30 (23.6% retracement) may push USD/JPY back towards the 112.40 (61.8% retracement) to 112.80 (38.2% expansion) region, with the next area of interest coming in around 111.10 (61.8% expansion) to 111.60 (38.2% retracement).

--- Written by David Song, Currency Strategist
Follow me on Twitter at @DavidJSong


