


Oil Price Talking Points
The price of oil consolidates following the string of failed attempts to test the February 2020 high ($54.66), but fresh data prints coming out of the US may influence energy prices as crude inventories are projected to contract for the sixth consecutive week.
Oil Price Outlook Supported by Forecasts for Lower US Crude Inventory
The price of oil appears to be stuck in a narrow range even though US President Joe Biden unveils a $1.9 trillion stimulus package called the American Rescue Plan, but pullback from the monthly high ($53.93) may turn out to be an exhaustion in the bullish price action rather than a change in trend as the Organization of the Petroleum Exporting Countries (OPEC) appear to be on track to regulate the energy market throughout 2021.
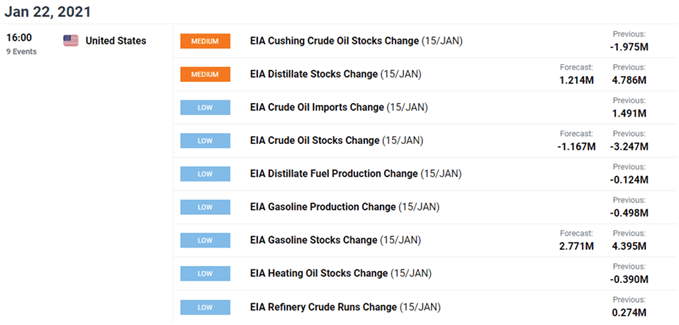
At the same time, fresh figures from the Energy Information Administration (EIA) is anticipated to show crude inventories falling 1.167M in the week ending January 15 following the 3.247M contraction the week prior, and the fresh figures may help to keep the price of oil afloat as long as US production sits at its lowest level since 2018.
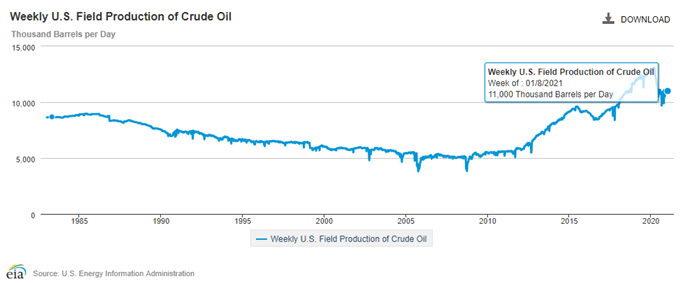
In fact, the previous update from the EIA revealed field production holding steady at 11,000K for the fifth consecutive week, and the ongoing weakness in US output may prop up oil prices ahead of the next OPEC Joint Ministerial Monitoring Committee (JMMC) Meeting on February 3 as Saudi Arabia plans to reduce supply by 1 million b/d until April 2021.
In turn, the price of oil may exhibit a bullish trend throughout the first quarter of 2021 as long as crude output remains subdued, and fresh data prints coming out of the US may lead to higher oil prices as the contraction in crude inventories instills an improved outlook for demand.
With that said, the technical outlook remains constructive as the price of oil trades above pre-pandemic levels, and crude may attempt to break out of the range bound price action from earlier this week as the Relative Strength Index (RSI) flirts with overbought territory.

Oil Price Daily Chart
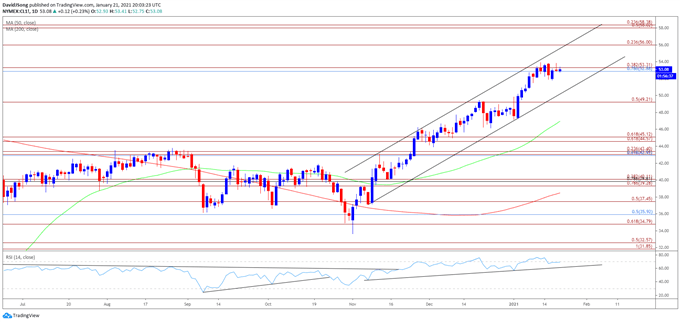
Source: Trading View
- Keep in mind, crude broke out of the range bound price action from the third quarter of 2020 following the failed attempt to close below the Fibonacci overlap around $34.80 (61.8% expansion) to $35.90 (50% retracement), and the price of oil may continue to retrace the decline from the start of 2020 as both the 50-Day SMA ($46.97) and 200-Day SMA( $38.48) establish a track a positive slope.
- Crude appears to be stuck in a narrow range following the string of failed attempts to test the February 2020 high ($54.66), but the RSI may offer a bullish signal as the oscillator flirts with overbought territory.
- A break above 70 in the RSI is likely to be accompanied by higher oil prices like the behavior seen earlier this month, with the move above the Fibonacci overlap around $52.90 (78.6% retracement) to $53.30 (38.2% expansion) keeping the February 2020 high ($54.66) on the radar.
- The $56.00 (23.6% expansion) handle sits next on the radar followed by the $58.00 (50% expansion) to $58.40 (23.6% expansion) region.

--- Written by David Song, Currency Strategist
Follow me on Twitter at @DavidJSong


