Gold Price Talking Points
The price of gold trades below the 50-Day SMA ($1859) once again as the V-shape recovery from the November low ($1765) unravels, and the Relative Strength Index (RS) indicates a further decline in the precious metal as the oscillator fails to retain the upward trend carried over from the previous month.
Gold Price Forecast: November Low on Radar as RSI Snaps Upward Trend
The price of gold snaps the range bound price action from the previous week to trade to a fresh monthly low ($1803), and bullion may continue to move to the beat of its own drum as the low interest rate environment along with the ballooning central bank balance sheets no longer provides a backstop for the precious metal.

It remains to be seen if the US Senate confirmation hearing for Treasury Secretary Janet Yellen will sway gold prices ahead of the inauguration of President-elect Joe Biden as the new administration unveils a $1.9 trillion stimulus package called the American Rescue Plan, but current market conditions may keep bullion under pressure ahead of the next Federal Reserve interest rate decision on January 27 as the central bank remains on track to increase its “holdings of Treasury securities by at least $80 billion per month and of agency mortgage-backed securities by at least $40 billion per month.”
Recent remarks from Boston Fed President Eric Rosengren suggest the Federal Open Market Committee (FOMC) will rely on its current tools to support the US economy as the official insists that “it is appropriate for us to continue to be buying both MBS and Treasury securities” during an interview with CNBC, with Rosengren going onto say that “it’s a little bit challenging at this stage to recreate” the Main Street Lending program as the economy recovers from the COVID-19 pandemic.
In turn, the US Dollar may continue to reflect an inverse relationship with investor confidence even though the Fed’s balance sheet narrows for the third consecutive week, but the price for gold may continue to move to the beat of its own drum as it no longer reflects the bullish behavior seen in the first-half of 2020.
With that said, the price of gold may continue to give back the rebound from the November low ($1765) as it snaps the range bound price action from the previous week, and the Relative Strength Index (RS) indicates a similar dynamic as it fails to retain the upward trend carried over from the previous month.
Gold Price Daily Chart
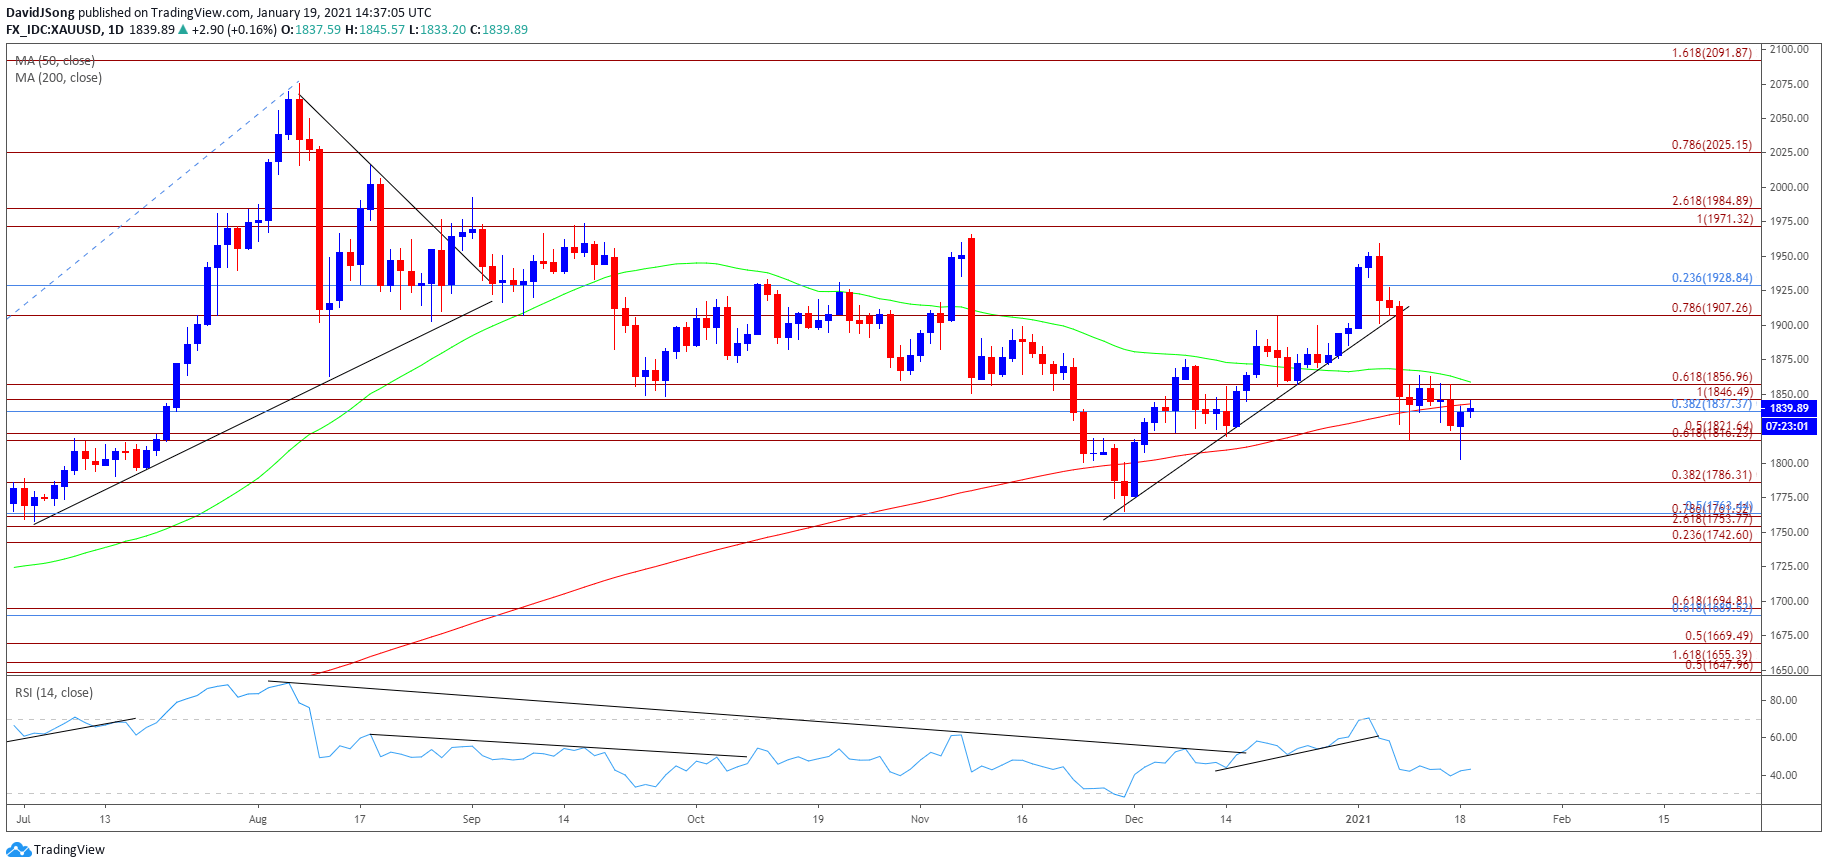
Source: Trading View
- The price of gold pushed to fresh yearly highs throughout the first half 2020, with the bullish price action also taking shape in August as the precious metal tagged a new record high ($2075).
- However, the bullish behavior failed to materialize in September as the price of gold traded below the 50-Day SMA ($1859) for the first time since June, with developments in the Relative Strength Index (RSI) negating the wedge/triangle formation established in August as the oscillator slipped to its lowest level since March.
- The correction from the record high ($2075) indicates a potential shift in market behavior rather than an exhaustion in the bullish trend as the price of gold trades at its lowest level since July, with the RSI highlighting a similar dynamic in late-2020 as it dipped into oversold territory for the first time since 2018.
- In turn, the V-shape recoverythat materialized ahead of the July low ($1758) may continue to unravel as the price of gold trades back below the 50-Day SMA (($1859) and snaps the range bound price action from the previous, with the RSI highlighting a similar dynamic as it fails to retain the upward trend carried over from December.
- Need a close below the Fibonacci overlap around $1816 (61.8% expansion) to $1822 (50% expansion) to bring the $1786 (38.2% expansion) region on the radar, with the next area of interest coming in around $1754 (261.8% expansion) to $1764 (50% retracement), which largely lines up with the November low ($1765).

--- Written by David Song, Currency Strategist
Follow me on Twitter at @DavidJSong