


Oil Price Talking Points
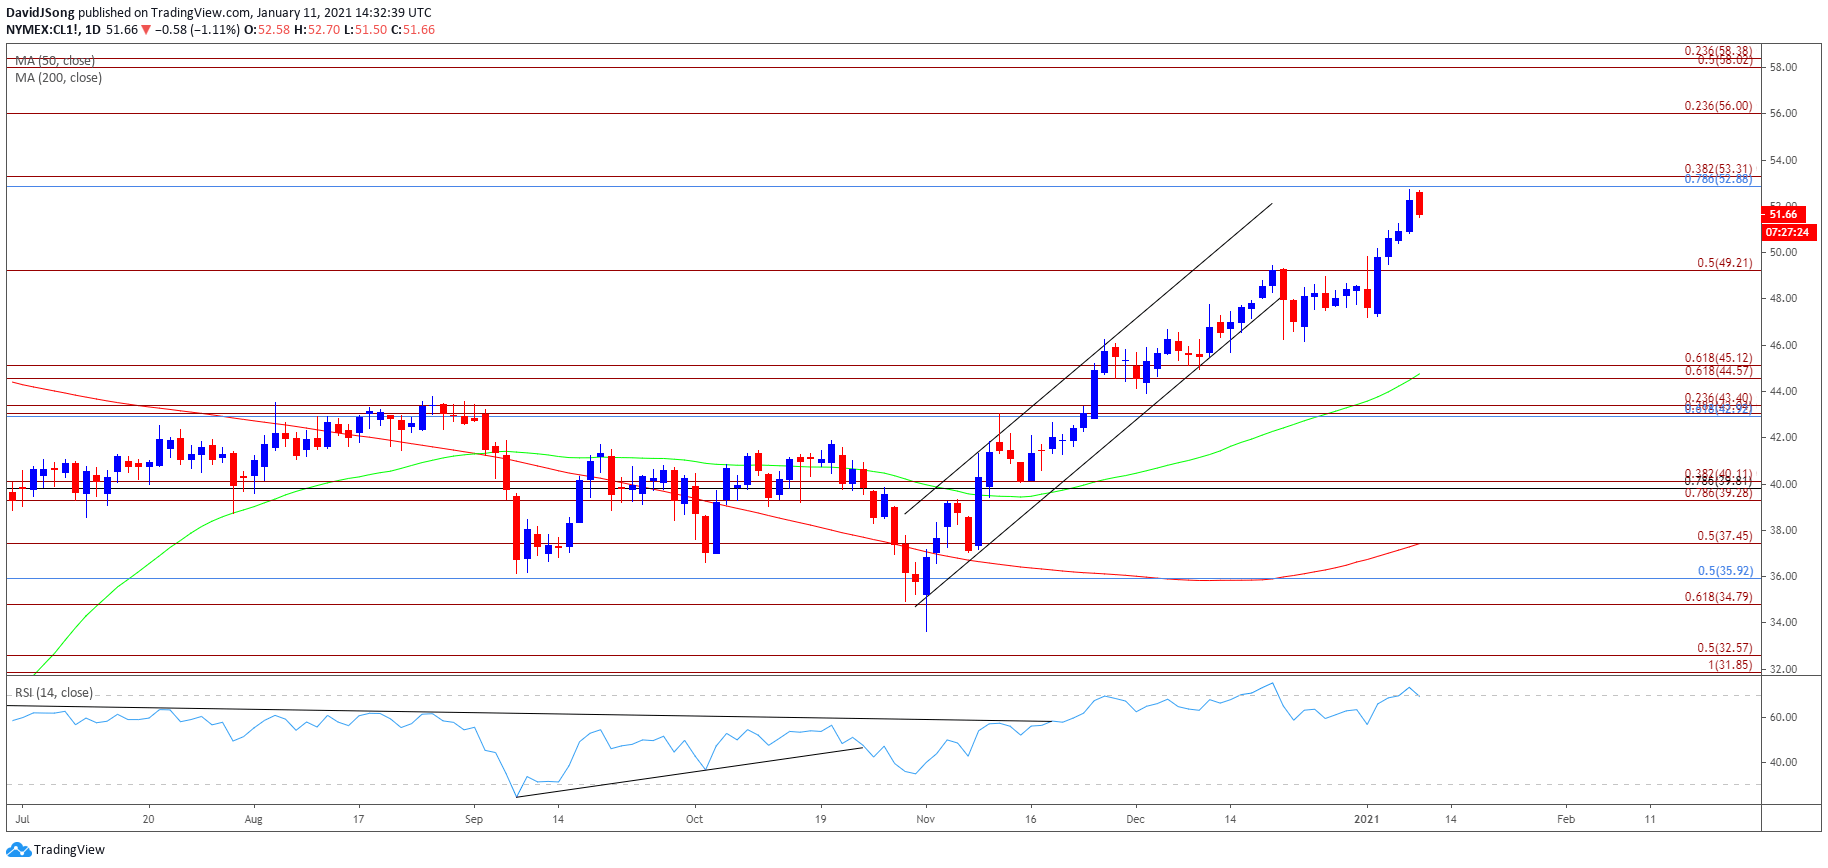
The recent rally in the price of oil appears to have stalled just ahead of the February 2020 high ($54.66) as it fails to extend the series of higher highs and lows from the previous week, and the Relative Strength Index (RSI) may indicate a textbook sell signal if the oscillator slips below 70.
Oil Forecast: Crude Price Rally Susceptible to RSI Sell Signal
The price of oil trades above pre-COVID19 levels as Saudi Arabia plans to cut crude production following the Organization of the Petroleum Exporting Countries (OPEC) meeting, and it seems as though the group will continue to regulate the energy market as “the return of stricter lockdown measures and growing uncertainties have resulted in a more fragile economic recovery that is expected to carry over into 2021.”
As a result, the ongoing commitment by OPEC and its allies may keep crude prices afloat ahead of the next Joint Ministerial Monitoring Committee (JMMC) Meeting on February 3 especially as US output remains at its lowest level since 2018.
In turn, the price of oil may exhibit a bullish trend throughout the first quarter of 2021 as both the 50-Day SMA ($44.77) and 200-Day SMA( $37.43) start to track a positive slope, while the Relative Strength Index (RSI) registers another extreme reading in January to mimic the extreme behavior last seen in 2019.
With that said, the technical outlook for crude remains constructive as the price of oil trades above pre-pandemic, but the RSI may indicate a textbook sell signal over the coming days if the oscillator slips below 70.

Oil Price Daily Chart
Source: Trading View
- Keep in mind, crude broke out of the range bound price action from the third quarter of 2020 following the failed attempt to close below the Fibonacci overlap around $34.80 (61.8% expansion) to $35.90 (50% retracement), and the price of oil may continue to retrace the decline from the start of 2020 as both the 50-Day SMA ($44.77) and 200-Day SMA( $37.43) establish a track a positive slope.
- The February 2020 high ($54.66) remains on the radar for crude as the Relative Strength Index (RSI) clings to overbought territory, but the oscillator may highlight a textbook sell signal if the indicator slips below 70.
- Lack of momentum to break/close above the Fibonacci overlap around $52.90 (78.6% retracement) to $53.30 (38.2% expansion) may push the price of oil back towards the $49.20 (50% expansion) region as it fails to extends the series of higher highs and lows from the previous week, with the next area of interest coming in around $44.60 (61.8% expansion) to $45.10 (61.8% expansion).

--- Written by David Song, Currency Strategist
Follow me on Twitter at @DavidJSong


