


Gold Price Talking Points
The price of gold bounces back from a fresh monthly low ($1860) on the back of US Dollar weakness, and bullion may continue to show an inverse relationship with the reserve currency as key market themes remain in place.
Gold Price Reverses Ahead of September Low with US Election on Tap
The price of goldmay trade within a defined range ahead of the US Presidential Election as it reverses ahead of the September low ($1849), but swings in investor confidence may influence the precious metal in November as ongoing negotiations for another fiscal stimulus program puts pressure on the Federal Reserve to further support the US economy.
The stalemate in Congress may become a growing concern for the Federal Open Market Committee (FOMC) as it raises the threat for a protracted recovery, and the central bank may continue to highlight a dovish forward guidance for monetary policy at its next interest rate decision on November 5 as Vice Chair Richard Clarida warns that “additional support from monetary—and likely fiscal—policy will be needed.”
In turn, the FOMC is likely to reiterate that the central bank will “increase our holdings of Treasury securities and agency mortgage-backed securities at least at the current pace,” and it remains to be seen if Chairman Jerome Powell and Co. will deploy more unconventional tools over the coming months as the committee adopts an outcome based approach for monetary policy.
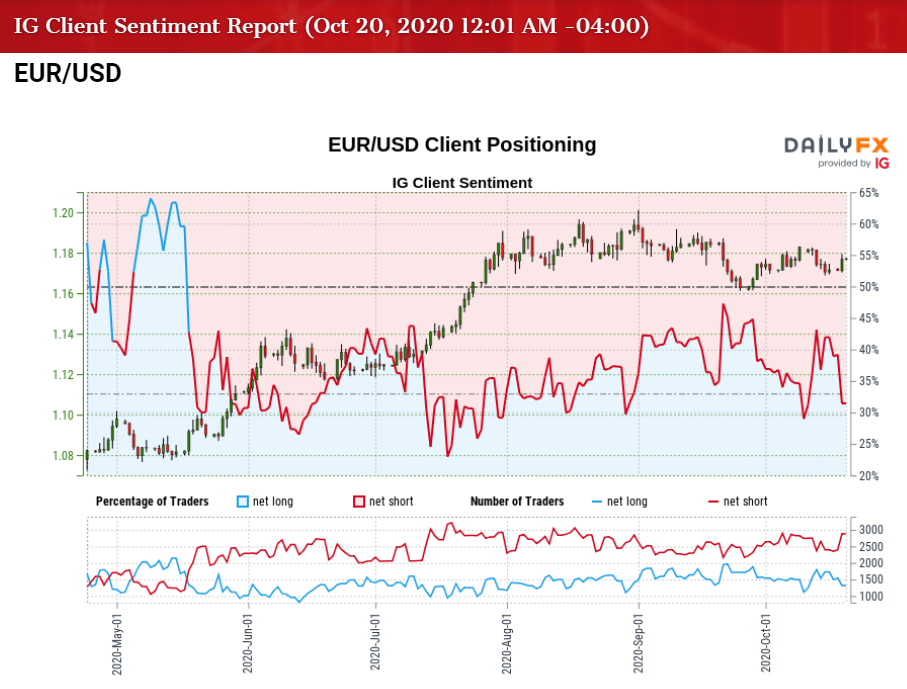
The dovish guidance provided by the FOMC may keep current market trends in place as the net-long US Dollar bias from earlier this year largely persists, with the IG Client Sentiment report showing retail traders net-long USD/CHF, USD/JPY and USD/CAD, while the crowd is net-short GBP/USD, EUR/USD and NZD/USD. However, the Australian Dollar continues to buck the trend as 51.96% of traders are currently net-long AUD/USD compared to 56.12% last week.
Nevertheless, the low interest environment along with the ballooning central bank balance sheets may continue to heighten the appeal of gold as an alternative to fiat-currencies, and it remains to be seen if the decline from the record high ($2075) will turn out to be a change in market behavior or an exhaustion in the bullish trend as the price of gold no longer traders to fresh yearly highs during every single month in 2020.
With that said, swings in investor confidence may influence bullion as it largely reflects an inverse relationship with the US Dollar, but the price of gold may trade within a define range ahead of the US election as it reverses ahead of the September low ($1849).

Gold Price Daily Chart
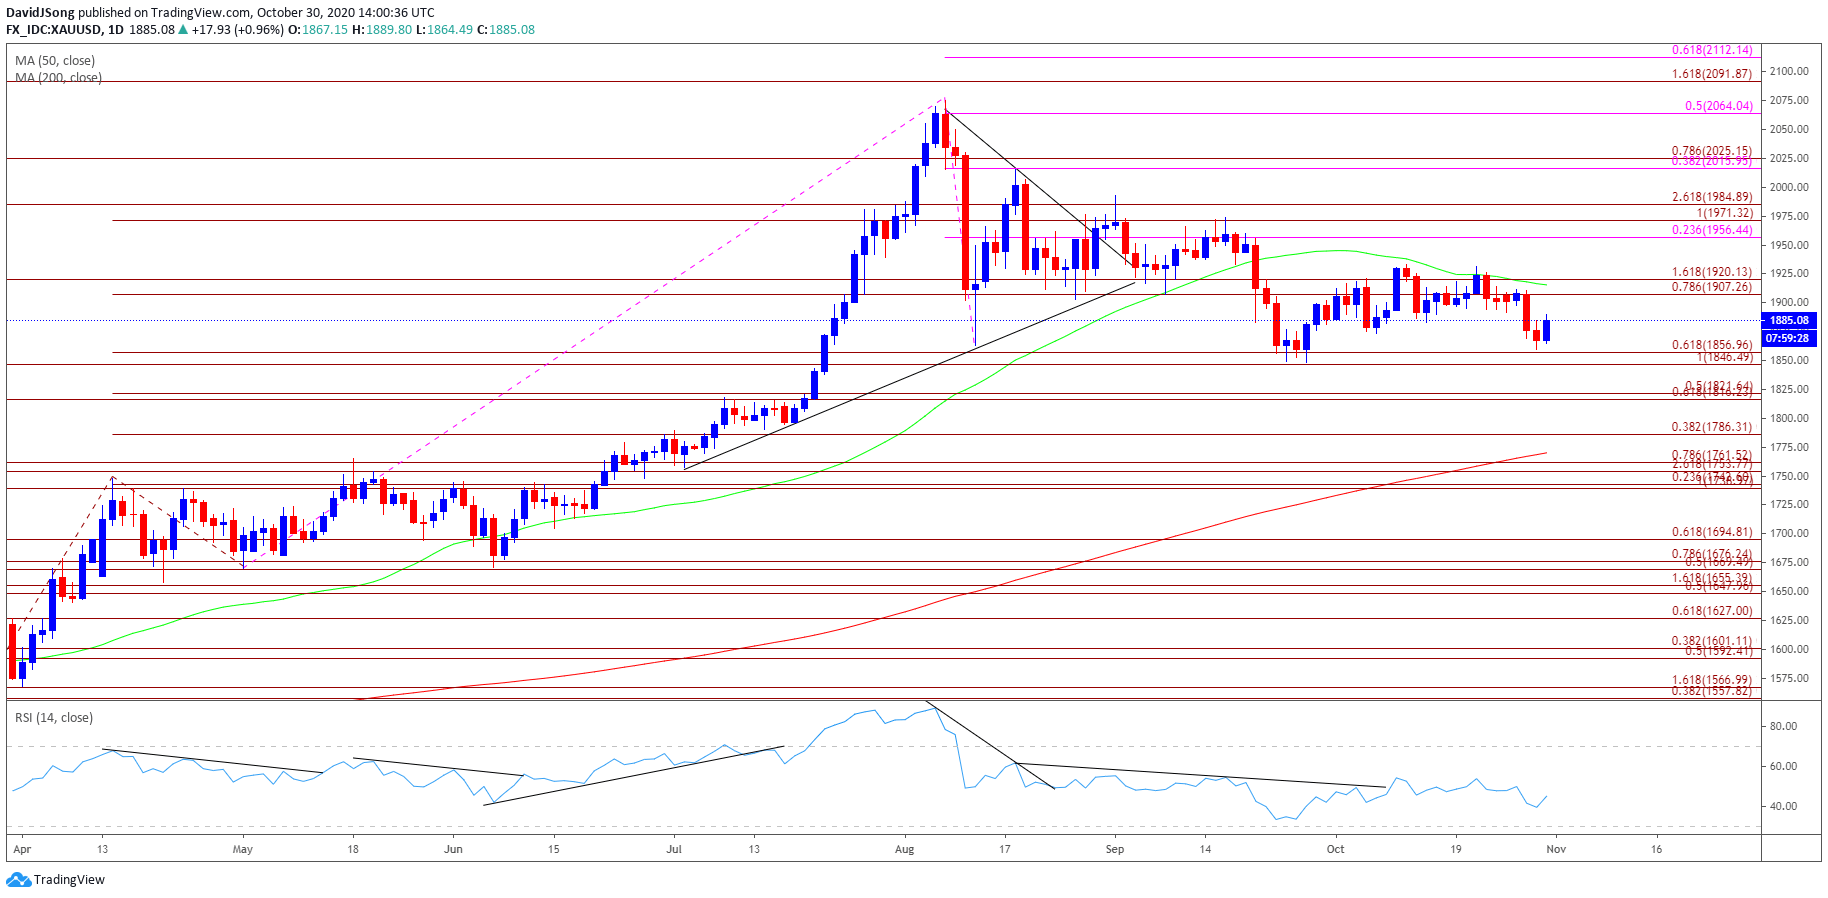
Source: Trading View
- The price of gold pushed to fresh yearly highs throughout the first half 2020, with the bullish price action also taking shape in August as the precious metal tagged a new record high ($2075).
- However, the bullish behavior failed to materialize in September as the price of gold traded below the 50-Day SMA ($1916) for the first time since June, with developments in the Relative Strength Index (RSI) negating the wedge/triangle formation established in August as the oscillator slipped to its lowest level since March.
- Nevertheless, the decline from the record high ($2075) may turn out to be an exhaustion in the bullish trend rather than a change in market behavior as the RSI reverses ahead of oversold territory and breaks out of the downward trend carried over from August.
- The price of gold appears to have reversed ahead of the September low ($1849), with the failed attempt to test the $1847 (100% expansion) to $1857 (61.8% expansion) bringing the Fibonacci overlap around $1907 (100% expansion) to $1920 (161.8% expansion) back on the radar.
- Need a break/close above the $1907 (100% expansion) to $1920 (161.8% expansion) region to open up the $1956 (23.6% expansion) area, with the next zone of interest coming in around $1971 (100% expansion) to $1985 (261.8% expansion).

--- Written by David Song, Currency Strategist
Follow me on Twitter at @DavidJSong


