


New Zealand Dollar Talking Points
NZD/USD snaps the series of lower highs and lows from the precious week as the recent weakness in investor confidence appears to be abating, and the exchange rate may consolidate going into October as the decline from the monthly high (0.6798) sputters ahead of the August low (0.6489).
NZD/USD Analysis: Bearish Price Sequence Sputters Ahead of August Low
NZD/USD continues to reflect the inverse relationship between the US Dollar and risk sentiment as the exchange rate rebounds from the monthly low (0.6536) and mimics the recent recovery in global equity prices.
NZD/USD may appreciate against its US counterpart even though the Reserve Bank of New Zealand (RBNZ) prepares to deploy a package of unconventional tools to further support the economy as “the Monetary Policy Committee agreed to continue with the Large Scale Asset Purchase (LSAP) Programme up to $100 billion.”
It seems as though the RBNZ will move away from quantitative easing (QE) as the central bank insists “that a package of an FLP (Funding for Lending Programme) and a lower or negative OCR (official cash rate) could provide an effective way to deliver additional monetary stimulus,” and the central bank may deploy a slew of non-standard measures at its last meeting for the year as Governor Adrian Orr and Co.“preferred to launch an FLP before the end of 2020.”
In turn, speculation for additional monetary support may produce headwinds for the New Zealand Dollar ahead of the next RBNZ meeting on November 1, but it remains to be seen if the central bank will tweak the LSAP after expanding the program in August.
Until then, swings in investor confidence may continue to sway NZD/USD as current market trends remain in place, and it seems as though the tilt in retail sentiment will carry into October as traders have been net-short the pair since mid-June.

The IG Client Sentiment report shows 42.19% of traders are net-long NZD/USD, with the ratio of traders short to long at 1.37 to 1. The number of traders net-long is 6.00% lower than yesterday and 27.03% higher from last week, while the number of traders net-short is 7.74% lower than yesterday and 29.23% lower from last week.
The rise in net-long position paired with the decline in net-short interest has helped to alleviate the tilt in retail sentiment as only 35.95% of traders were net-long the pair last week, but the crowding behavior looks poised to persist even though the decline from the monthly high (0.6798) sputters ahead of the August low (0.6489).
With that said, NZD/USD may consolidate over the coming days as it fails to extend the bearish price sequence from the previous week, and the exchange rate may continue to reflect the inverse relationship between the US Dollar and risk sentiment as the rebound from the monthly low (0.6536)largely tracks the recent recovery in global equity prices.

Sign up and join DailyFX Currency Strategist David Song LIVE for an opportunity to discuss potential trade setups.
NZD/USD Rate Daily Chart
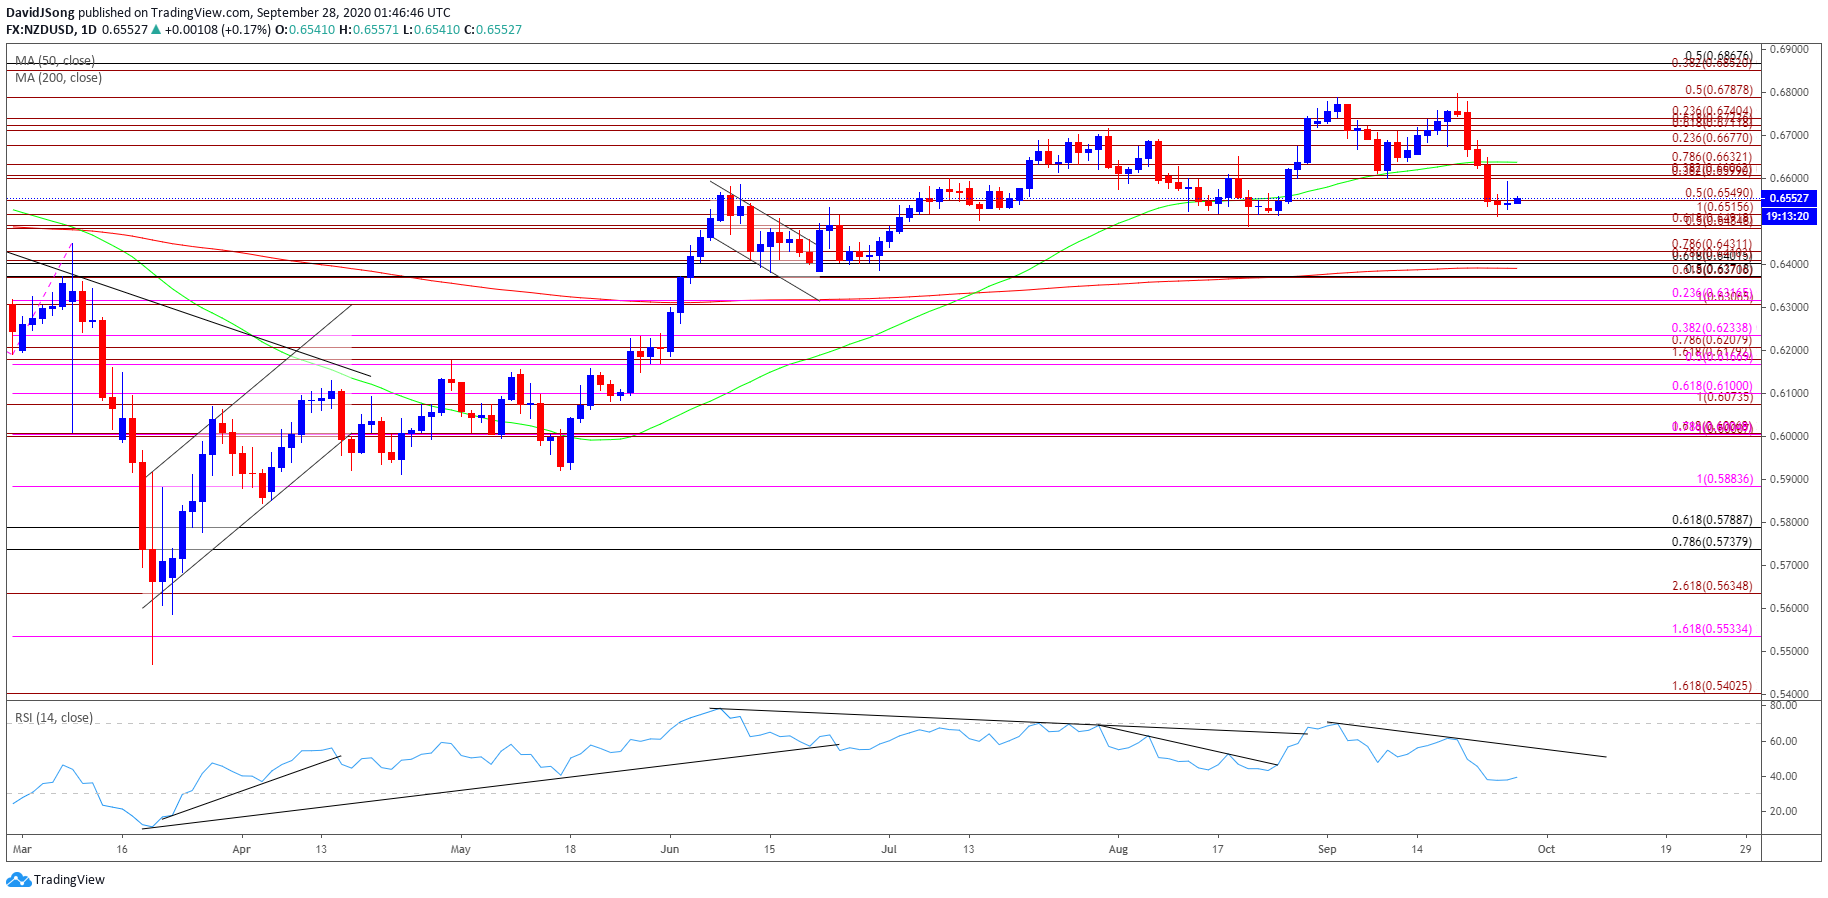
Source: Trading View
- Keep in mind, NZD/USD cleared the February high (0.6503) in June as the Relative Strength Index (RSI) broke above 70 for the first time in 2020, with the exchange rate taking out the January high (0.6733) in September following the close above the Fibonacci overlap around 0.6710 (61.8% expansion) to 0.6740 (23.6% expansion).
- However, lack of momentum to close above the 0.6790 (50% expansion) region has pushed NZD/USD below the Fibonacci overlap around 0.6600 (38.2% expansion) to 0.6630 (78.6% expansion), with the RSI sitting at its lowest level since April.
- NZD/USD appeared to be on track to test the August low (0.6489) as the RSI established a downward trend in September, but the decline from the 2020 high (0.6798) appears to be unraveling amid failed attempt to break/close below the Fibonacci overlap around 0.6490 (50% expansion) to 0.6520 (100% expansion).
- Lack of momentum to hold below the 0.6550 (50% expansion) region may push NZD/USD back towards the overlap around 0.6600 (38.2% expansion) to 0.6630 (78.6% expansion), with the next area of interest coming in around 0.6680 (23.6% expansion).
- Will keep a close eye on the RSI as it appears to be reversing course ahead of oversold territory, but need a break of trendline resistance to indicate a bullish outlook for NZD/USD.

--- Written by David Song, Currency Strategist
Follow me on Twitter at @DavidJSong


