


Gold Price Talking Points
The price of gold continues to trade within the monthly range following the Federal Reserve interest rate decision, and current market trends may keep the precious metal afloat as the crowding behavior in the US Dollar persists in September.
Gold Price Continues to Rebound from 50-Day SMA Following FOMC
The price of gold tagged the 50-Day SMA ($1935) for the second time this month as the update to the Fed’s Summary of Economic Projections (SEP) showed no change in the interest rate dot-plot, and it seems as though the central bank is in rush to alter the path for monetary policy as the longer run interest rate forecast remains unchanged from the June meeting.
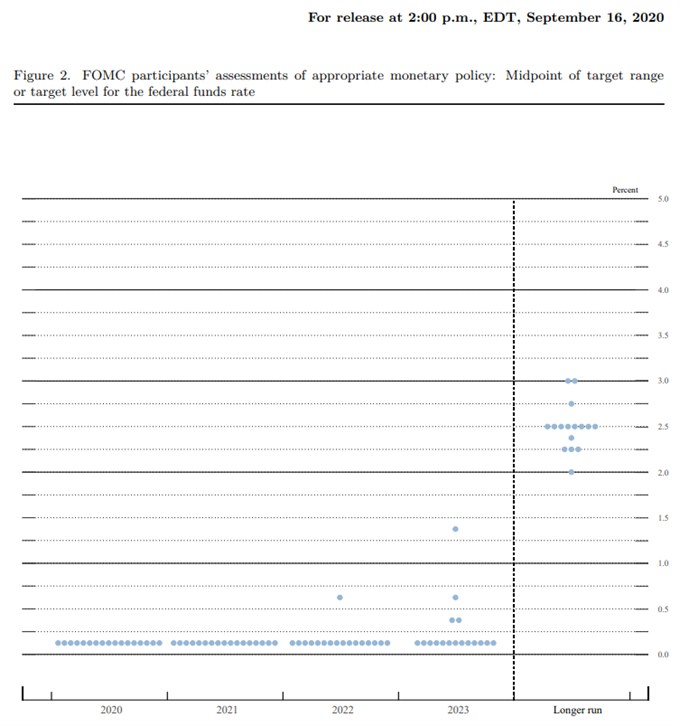
Source: FOMC
The reaction suggests market participants were anticipating a more dovish forward guidance as the Federal Open Market Committee (FOMC)plans to “achieve inflation moderately above 2 percent for some time so that inflation averages 2 percent over time,” but little hints of a looming shift in the monetary policy outlook are likely to keep current market trends in place as the central bank remains on track to “increase its holdings of Treasury securities and agency mortgage-backed securities at least at the current pace.”
Looking ahead, Chairman Jerome Powell and Co. may stick to the same script at the next interest rate decision on November 5 as “forecasts from FOMC participants for economic growth this year have been revised up,” but the wait-and-see approach may continue to coincide with the crowding behavior in the US dollar even though the Fed’s balance sheet climbs back above $7 trillion in August.

The IG Client Sentiment report once again reflects a net-long US Dollar bias as retail traders are net-long USD/CHF, USD/CAD and USD/JPY, while the crowd is net-short GBP/USD, AUD/USD, EUR/USD and NZD/USD.
It seems as though the tilt in retail sentiment will persist as the macroeconomic environment remains largely unchanged, and the pullback from the record high ($2075) may prove to be an exhaustion in the bullish trend rather than a change in market behavior as the price ofgold trades to fresh yearly highs during every single month so far in 2020.
With that said, it remains to be seen if bullion will extend the rebound from the 50-Day SMA ($1935) as the moving average continues to track the positive slope from earlier this year, and the Relative Strength Index (RSI) may help to validate the continuation pattern established in August as the indicator appears to be bouncing back from its lowest reading since June.

Sign up and join DailyFX Currency Strategist David Song LIVE for an opportunity to discuss potential trade setups.
Gold Price Daily Chart
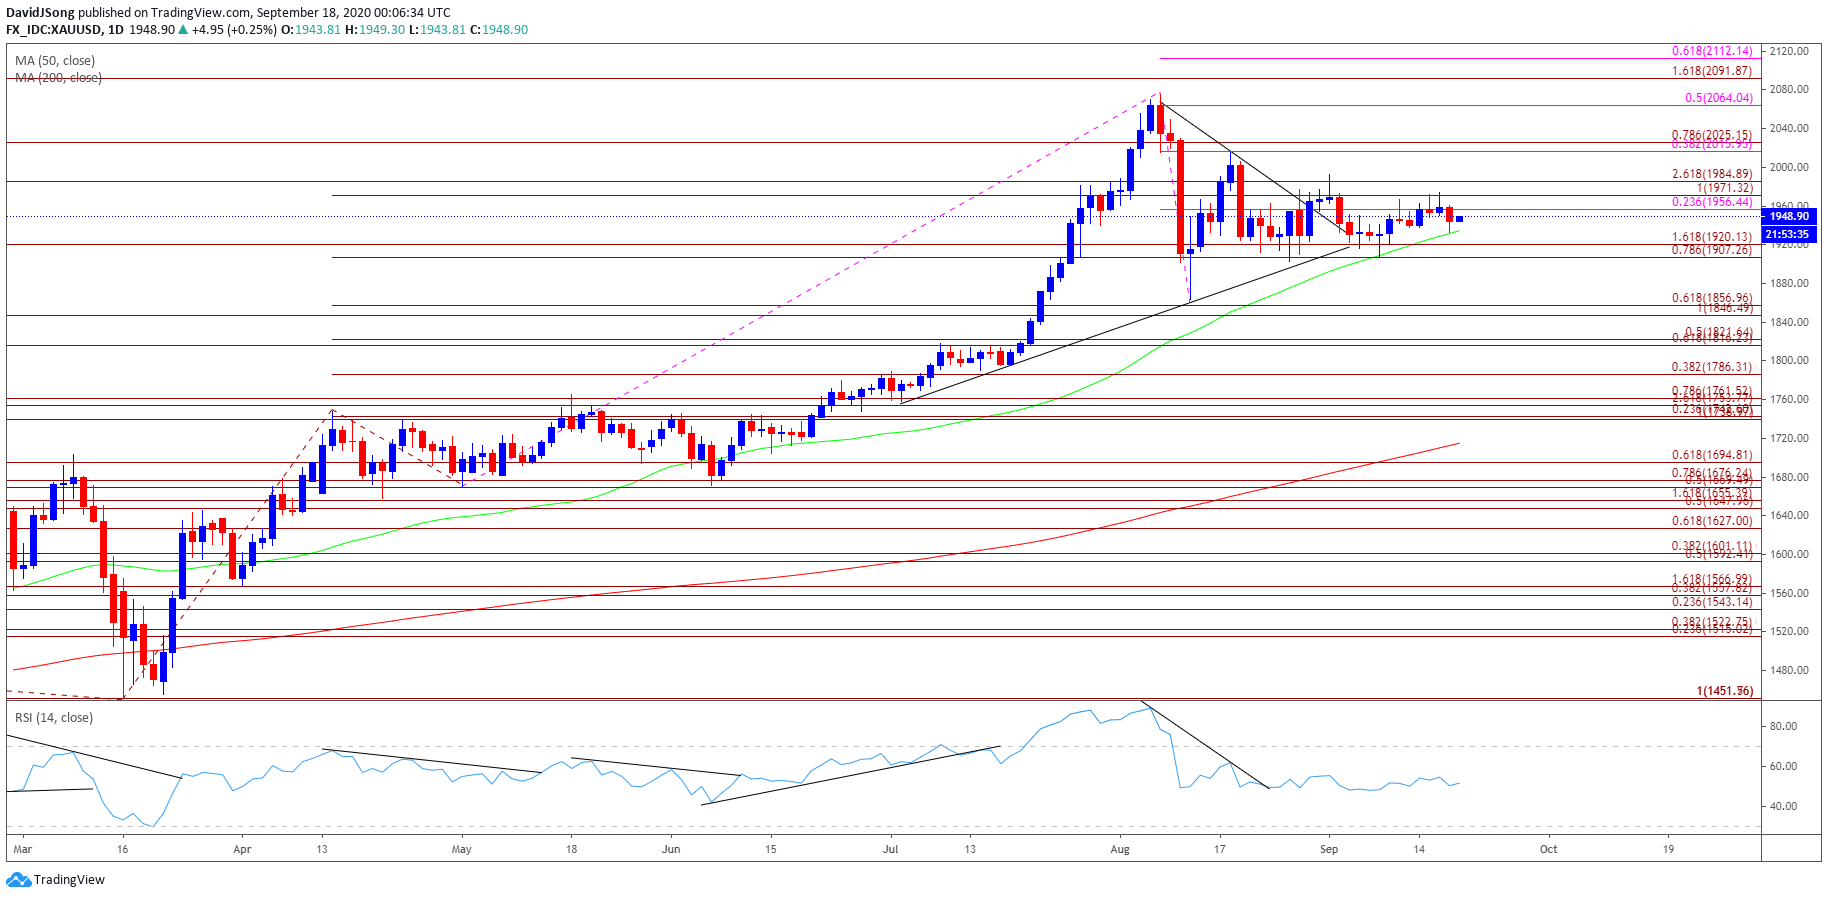
Source: Trading View
- The technical outlook for the price of gold remains constructive as it trades to fresh yearly highs during every single month so far in 2020, with the bullish price action also taking shape in August as precious metal tagged a new 2020 high ($2075).
- The price of gold cleared the previous record high recorded in September 2011 ($1921) even though the Relative Strength Index (RSI) failed to retain the upward from June, but the indicator registered a new extreme reading (88) for 2020 as the oscillator pushed into overbought territory for the third time this year.
- In turn, theRSI sell-signalregistered in August could be indicative of a potential exhaustion in the bullish behavior rather than a change in trend as it breaks out of the downward trend, and the indicator may help to validate the wedge/triangle formation as the oscillatorappears to be bouncing back from its lowest reading since June.
- Will keep a close eye on the RSI as it seems to have bottomed out in September, but need to see the oscillator to push towards overbought territory to indicate a bullish outlook, with a move above 70 likely to be accompanied by higher gold prices like the behavior seen in July.
- Until then, the price of gold may continue to consolidate following the string of failed attempt to close below $1907 (100% expansion) to $1920 (161.8% expansion), but need a closing price above the Fibonacci overlap around $1971 (100% expansion) to $1985 (261.8% expansion) to bring the $2016 (38.2% expansion) to $2025 (78.6% expansion) region back on the radar.
- A break/close above the $2016 (38.2% expansion) to $2025 (78.6% expansion) region opens up the record high price ($2075), with the next area of interest coming in around $2064 (50% expansion) followed by $2092 (161.8% expansion).

--- Written by David Song, Currency Strategist
Follow me on Twitter at @DavidJSong


