


Gold Price Talking Points
The price of gold continues to track the August range as it quickly retraces the decline following the US Non-Farm Payrolls (NFP) report, and current market trends may keep the precious metal afloat as the crowding behavior in the US Dollar looks poised to persist ahead of the Federal Reserve interest rate decision on September 16.
Gold Price Recoups Post-NFP Losses amid Ongoing Tilt in USD Sentiment
The price of gold snaps the series of lower highs and lows from the previous week as it bounces back from a fresh monthly low ($1917), and the pullback from the record high ($2075) may prove to be an exhaustion in the bullish price action rather than a change in trend as bullion trades to fresh yearly highs during every single month so far in 2020.
It remains to be seen if the trend will continue in September as the updated NFP report shows a further improvement in the labor market, with the US economy adding 1.371 million jobs in August amid projections for a 1.350 million print.
The fresh data prints may encourage the Federal Reserve to gradually adjust the monetary policy outlook as Chairman Jerome Powell and Co. discuss an outcome-based approach versus a calendar-based forward guidance for monetary policy, but it seems as though the Federal Open Market Committee (FOMC) is in no rush to scale back its emergency measures as the central bank plans to “achieve inflation that averages 2 percent over time.”
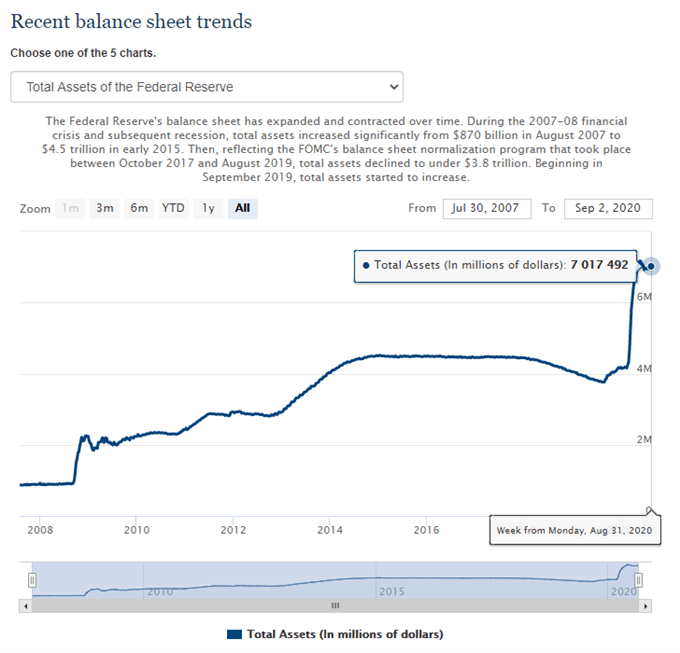
Source: FOMC
In turn, current market trends may keep the price of gold afloat as the Fed’s balance sheet climbs back above $7 trillion in August, and the low interest rate environment along with the ballooning central bank balance sheets may continue to heighten the appeal of bullion as an alternative to fiat-currencies as long as the FOMC vows to “increase its holdings of Treasury securities and agency residential and commercial mortgage-backed securities at least at the current pace.”
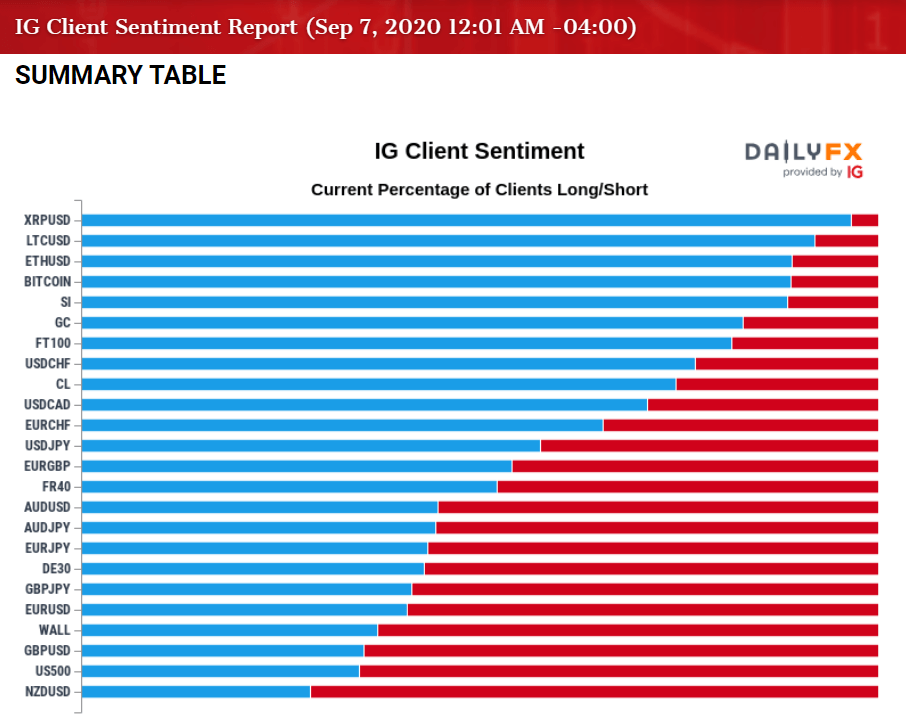
At the same time, the crowding behavior in the US Dollar looks poised to persist as the IG Client Sentiment report continues to show retail traders net-long USD/CHF, USD/CAD and USD/JPY, while the crowd remains net-short AUD/USD, EUR/USD, GBP/USD and NZD/USD.
The ongoing tilt in retail sentiment may continue to coincide with the bullish behavior in gold as a bear-flag formation emerges in the DXY index, and a similar scenario may take shape for the precious metal as a continuation pattern appears to have materialized in August.
With that said, the pullback from the record high ($2075) may prove to be an exhaustion in the bullish price action rather than a change in trend, and the Relative Strength Index (RSI) may help to validate the wedge/triangle formation as it attempts to bounce back from its lowest reading since June.

Sign up and join DailyFX Currency Strategist David Song LIVE for an opportunity to discuss potential trade setups.
Gold Price Daily Chart
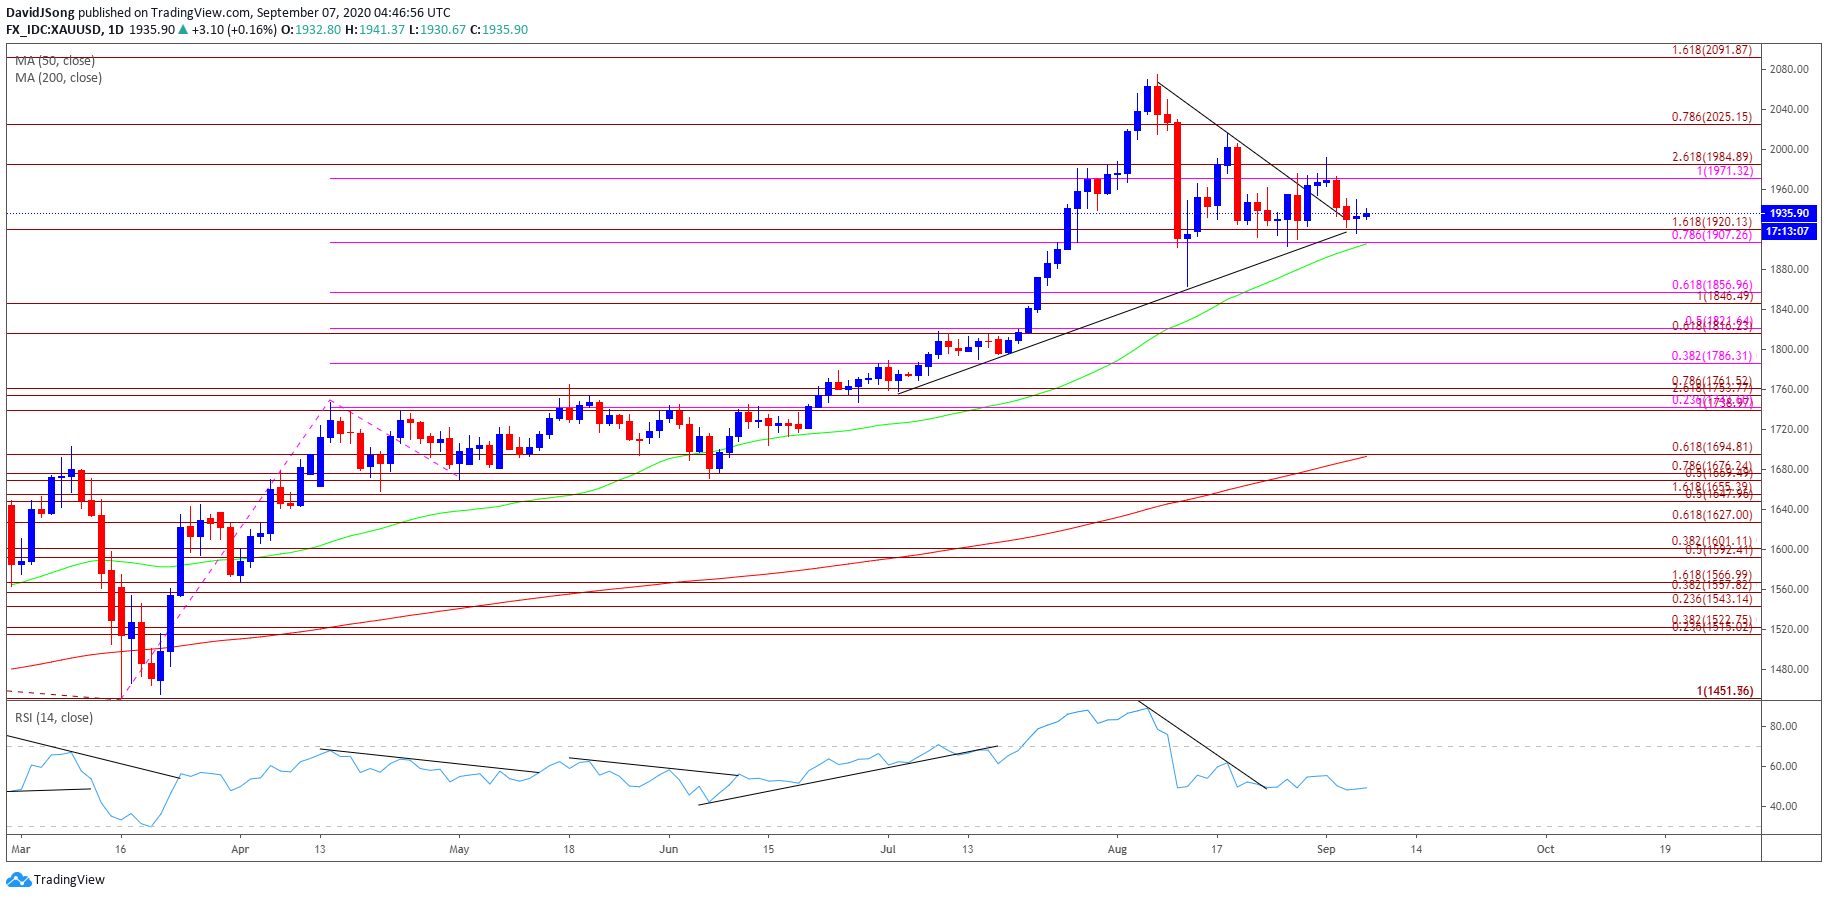
Source: Trading View
- The technical outlook for the price of gold remains constructive as it trades to fresh yearly highs during every single month so far in 2020, with the bullish behavior also taking shape in August as precious metal tagged a new 2020 high ($2075).
- The price of gold cleared the previous record high recorded in September 2011 ($1921) even though the Relative Strength Index (RSI) failed to retain the upward from June, but the indicator registered a new extreme reading (88) for 2020 as the oscillator pushed into overbought territory for the third time this year.
- In turn, therecent sell-signalin the RSI could be indicative of a potential exhaustion in the bullish behavior rather than a change in trend as it recovers from its lowest reading since June, and the indicator may help to validate the wedge/triangle formation as it breaks out of the downward trend established earlier this month.
- Will keep a close eye on the RSI as it appears to have bottomed out in August, but need to see the oscillator to push towards overbought territory to indicate a bullish outlook, with a push above 70 likely to be accompanied by higher gold prices like the behavior seen in July.
- Until then, the price of gold may continue to consolidate as it marks another failed attempt to close below $1907 (100% expansion) to $1920 (161.8% expansion), but need a closing price above the Fibonacci overlap around $1971 (100% expansion) to $1985 (261.8% expansion) to bring the $2025 (78.6% expansion) region back on the radar.
- A break/close above $2025 (78.6% expansion) opens up the record high price ($2075), with the next area of interest coming in around $2092 (161.8% expansion).

--- Written by David Song, Currency Strategist
Follow me on Twitter at @DavidJSong


