


Gold Price Talking Points
The price of gold is little changed from the start of the week even though the Federal Reserve plans to “achieve inflation that averages 2 percent over time,” but the pullback from the record high ($2075) may prove to be an exhaustion in the bullish price action rather than a change in trend as the Relative Strength Index (RSI) appears to be bouncing back from its lowest reading since June.
Gold Prices to Watch as RSI Rebounds From Lowest Reading Since June
The price of gold continues to consolidate within the August range after marking the longest stretch of gains (nine consecutive weeks) since 2006, but a wedge/triangle formation may pan out in September as the Federal Reserve Economic Symposium offers little evidence of a looming change in the path for monetary policy.
It seems as though Fed officials will continue offer greater clarity surrounding the changes to the Statement on Longer-Run Goals and Monetary Policy Strategy as Governor Lael Brainard emphasizes that “FAIT (flexible average inflation targeting) means that appropriate monetary policy would likely aim to achieve inflation moderately above 2 percent for a time to compensate for a period, such as the present, when it has been persistently below 2 percent.”
The comments from Chairman Jerome Powell and Co. suggests the Federal Open Market Committee (FOMC) will stick to the status quo at the next interest rate decision on September 16, and it remains to be seen if the update to the US Non-Farm Payrolls (NFP) report will influence the monetary policy outlook as the economy is expected to add 1.4 million jobs in August.
Until then, the low interest rate environment along with the ballooning central bank balance sheets may continue to heighten the appeal of bullion as an alternative to fiat-currencies, and current market trends look poised to persist over the coming days as the crowding behavior in the US Dollar carries into September.
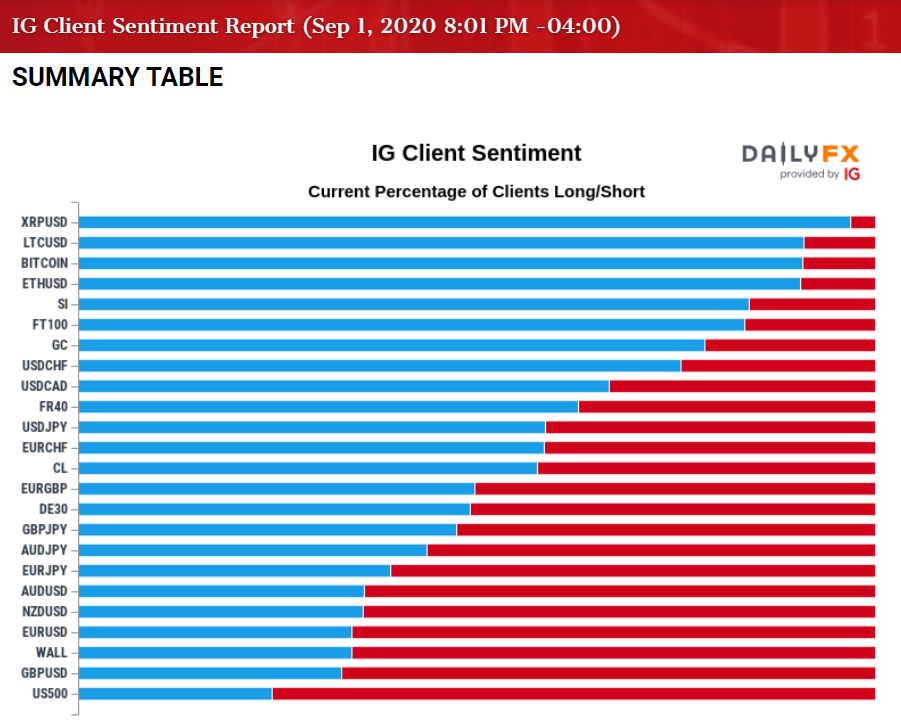
The IG Client Sentiment report continues to show retail traders net-long USD/CHF, USD/CAD and USD/JPY, while the crowd remains net-short AUD/USD, NZD/USD, EUR/USD and GBP/USD even though the FOMC remains reluctant to scale back its emergency measures.
In turn, the ongoing tilt in retail sentiment may continue to coincide with the bullish behavior in gold as the DXY index is on the verge of breaking a key support zone, and the pullback from the record high ($2075) may prove to be an exhaustion in the bullish price action rather than a change in trend as bullion trades to fresh yearly highs during every single month so far in 2020.
With that said, a continuation price pattern appears to have taken shape as gold consolidates within the August range, and the Relative Strength Index (RSI) may help to validate the wedge/triangle formation as it breaks out of a downward trend and attempts to bounce back from its lowest reading since June.

Sign up and join DailyFX Currency Strategist David Song LIVE for an opportunity to discuss potential trade setups.
Gold Price Daily Chart
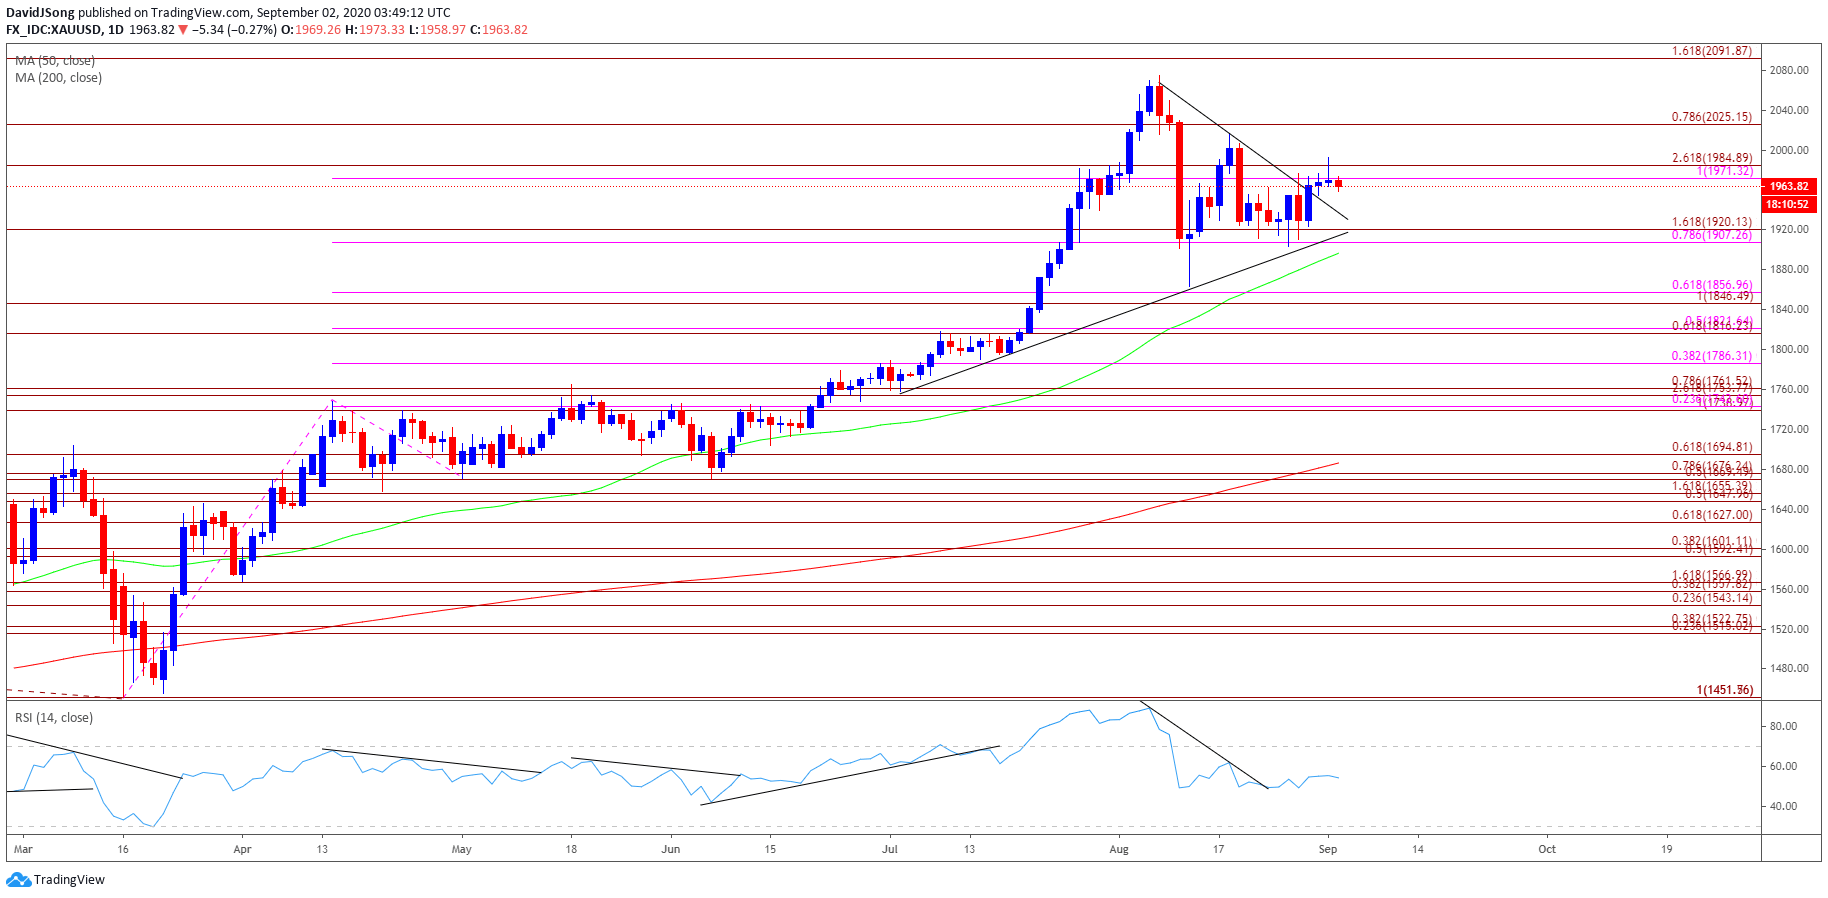
Source: Trading View
- The technical outlook for the price of gold remains constructive as it trades to fresh yearly highs during every single month so far in 2020, with the bullish behavior also taking shape in August as precious metal tagged a new 2020 high ($2075).
- The price of gold cleared the previous record high recorded in September 2011 ($1921) even though the Relative Strength Index (RSI) failed to retain the upward from June, but the indicator registered a new extreme reading (88) for 2020 as the oscillator pushed into overbought territory for the third time this year.
- In turn, therecent sell-signalin the RSI could be indicative of a potential exhaustion in the bullish behavior rather than a change in trend as it recovers from its lowest reading since June, and the indicator may help to validate the wedge/triangle formation as it breaks out of the downward trend established earlier this month.
- Will keep a close eye on the RSI as it appears to have bottomed out in August, but need to see the oscillator to push towards overbought territory to indicate a bullish outlook, with a push above 70 likely to be accompanied by higher gold prices like the behavior seen in July.
- Until then, the price of gold may continue to face range bound conditions following the string of failed attempts to close below the $1907 (100% expansion) to $1920 (161.8% expansion), but need a closing price above the Fibonacci overlap around $1971 (100% expansion) to $1985 (261.8% expansion) to bring the $2025 (78.6% expansion) region back on the radar.
- A break/close above $2025 (78.6% expansion) opens up the record high price ($2075), with the next area of interest coming in around $2092 (161.8% expansion).

--- Written by David Song, Currency Strategist
Follow me on Twitter at @DavidJSong


