


Canadian Dollar Talking Points
USD/CAD snaps back ahead of the monthly low (1.3133) to retain the range bound price action from the previous week, but the recent rebound in the exchange rate may prove to be an exhaustion in the bearish behavior rather than a change in trend as key market themes look poised to persist in September.
USD/CAD Rate Trades in Defined Price Range Ahead of September
The depreciation in USD/CAD appears to have stalled following the Federal Open Market Committee (FOMC) Minutes as it holds the monthly range, with the Relative Strength Index (RSI) indicative of a failed attempt to test the January low (1.2957) as it deviates with price after struggling to push into oversold territory.
It remains to be seen if Federal Reserve officials will reveal new information at the Economic Symposium scheduled for August 27-28 as Chairman Jerome Powell and Co. discuss an outcome-based approach versus a calendar-based forward guidance for monetary policy, but the actions taken by the FOMC suggest the central bank is in no rush to scale back its emergency measures as the committee votes unanimously to push back “the expiration of the temporary U.S. Dollar liquidity swap lines through March 31, 2021.”
In turn, the Fed symposium may foreshadow more of the same for the next interest rate decision on September 16 as the central bank vows to “increase its holdings of Treasury securities and agency residential and commercial mortgage-backed securities at least at the current pace,” and the macroeconomic environment may continue to produce headwinds for the US Dollar as the Fed’s balance sheet climbs back above $7 trillion in August.
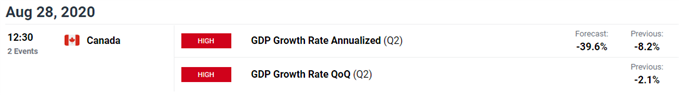
Meanwhile, the Canadian Dollar may react to Canada’s Gross Domestic Product (GDP) report as the growth rate is projected to plunge 39.6% in the second quarter after contracting 8.2% per annum during the first three-months of 2020, but the update may do little to sway the Bank of Canada (BoC) as the economic shock from COVID-19 appears to be “considerably less severe than the worst scenarios presented in the April MPR (Monetary Policy Report).”
As a result, Governor Tiff Macklem and Co. may stick to the same script at the next meeting on September 9 as the central bank pledges to carry out “its large-scale asset purchase program at a pace of at least $5 billion per week,” and current market trends may persist over the coming days as the FOMC and BoC appear to be in no rush to alter the path for monetary policy.
At the same time, the crowding behavior in the US Dollar may also carry into September as retail traders have been net-long USD/CAD since mid-May.
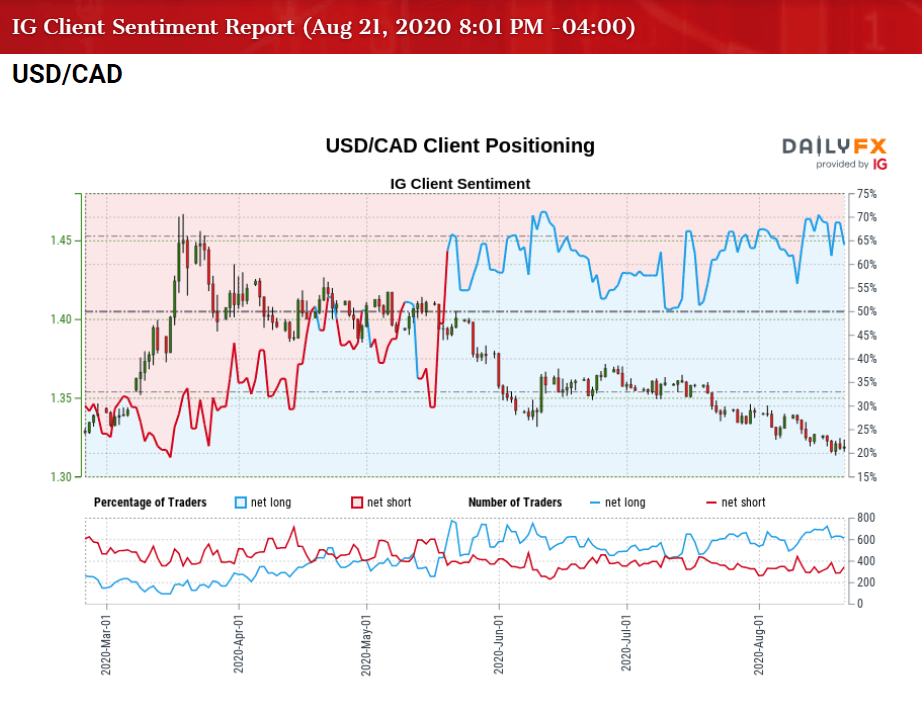
The latest update to the IG Client Sentiment report shows 65.83% of traders are still net-long USD/CAD, with the ratio of traders long to short at 1.93 to 1. The number of traders net-long is 1.63% lower than yesterday and 18.35% lower from last week, while the number of traders net-short is 6.55% lower than yesterday and 5.72% higher from last week.
The decline in net-long interest could be a result of stop-loss orders getting triggered as USD/CAD dipped to a fresh monthly low (1.3133) last week, while the rise in net-short position comes as the exchange rate appears to be stuck in a narrow range.
With that said, the widening Fed’s balance sheet along with the crowding behavior in the US Dollar may keep USD/CAD under pressure, but the string of failed attempts to test the January low (1.2957) may continue to produce range bound conditions ahead of the major event risks coming out of the US and Canada as the Relative Strength Index (RSI) appears to be deviating with price after struggling to push into oversold territory.

Sign up and join DailyFX Currency Strategist David Song LIVE for an opportunity to discuss potential trade setups.
USD/CAD Rate Daily Chart
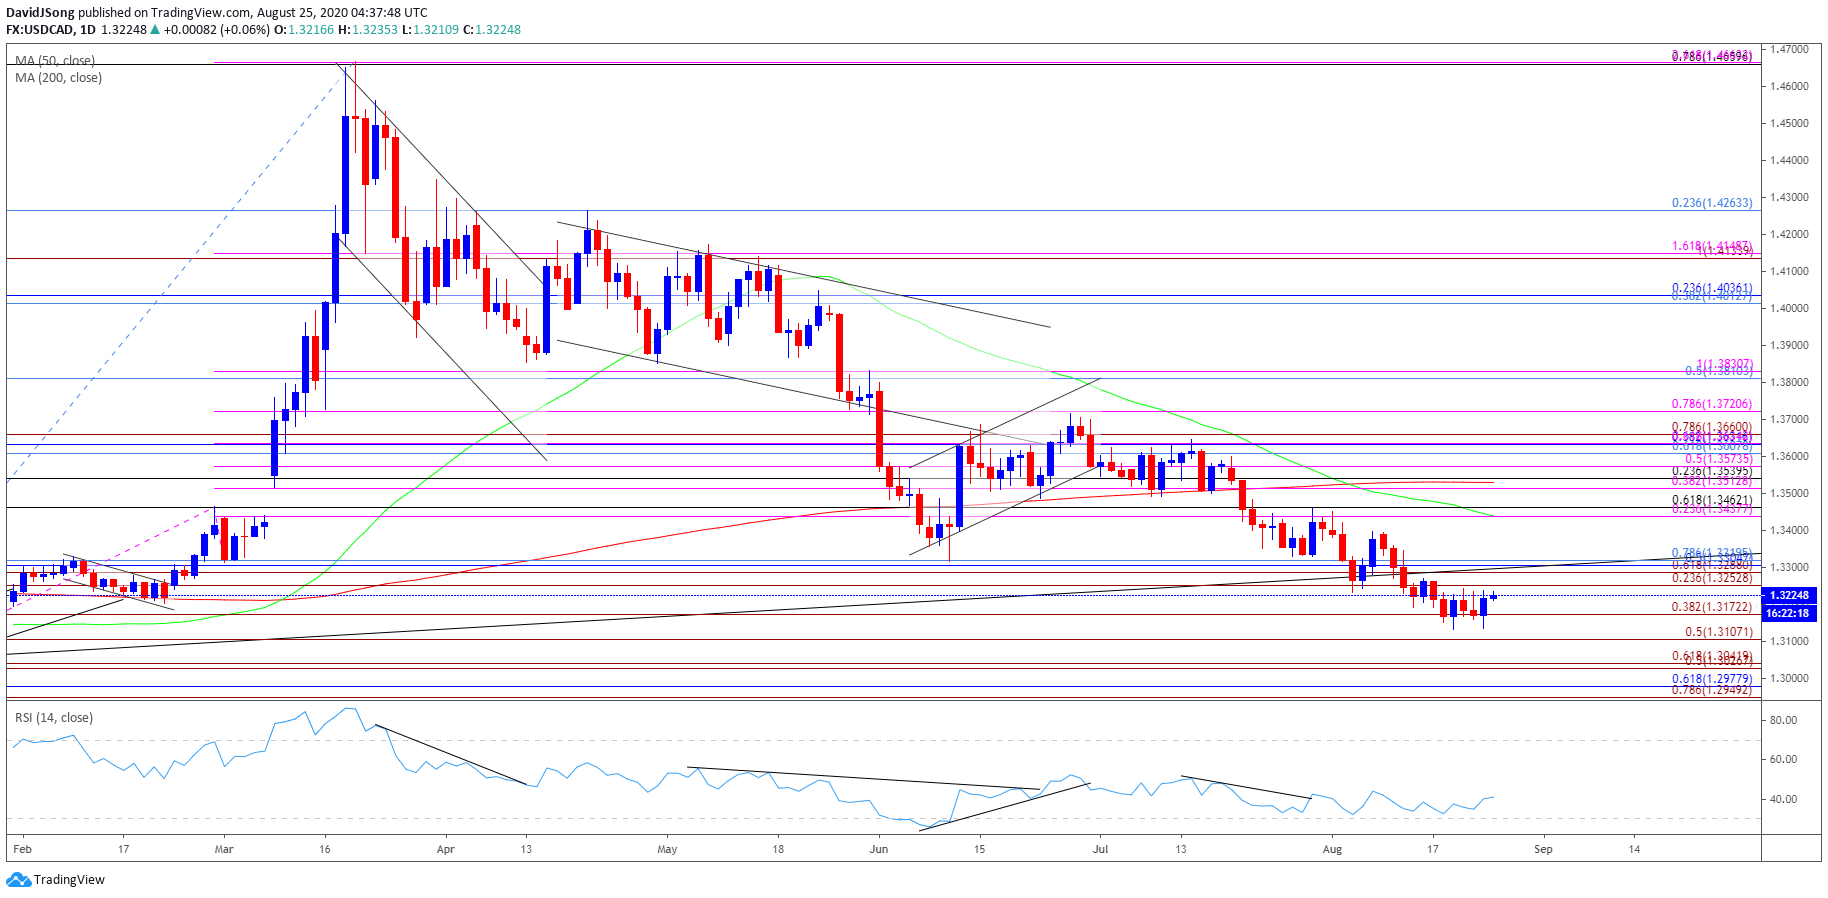
Source: Trading View
- Keep in mind, the USD/CAD correction from the 2020 high (1.4667) managed to fill the price gap from March, with the decline in the exchange rate pushing the Relative Strength Index (RSI) into oversold territory for the first time since the start of the year.
- Nevertheless, USD/CAD reversed from the March low (1.3315) in June, with both price and the RSI carving an upward trend during the month, but the bullish formations have been largely negated as the exchange rate snapped the range bound price action during the first half of July.
- USD/CAD managed to track the June range throughout the previous month as the RSI broke out of the downward trend established in July, but the failed attempt to push back above the 1.3440 (23.6% expansion) to 1.3460 (61.8% retracement) region has spurred a break of the March/June low (1.3315) even though the momentum indicator failed to push into oversold territory.
- The RSI appears to be deviating with price as it reverses course ahead of oversold territory, but the failed attempts to break below 30 may indicate a potential exhaustion in the bearish price action rather than a change in trend as the 50-Day SMA (1.3440) continues to track a negative slope.
- Keep in mind, a ‘death cross’ formation seemed to have taken shape in August as the 50-Day SMA (1.3440) crossed below the 200-Day SMA (1.3530), but the difference in slope undermines the bearish signal as especially as USD/CAD fails to test the January low (1.2957) ahead of September.
- Lack of momentum to test 1.3110 (50% expansion) has pushed USD/CAD back above the 1.3170 (50% expansion) region, but the exchange rate may continue to face range bound prices as it appears to be capped by the 1.3250 (23.6% expansion) area.
- Need a break/close above 1.3250 (23.6% expansion) to open up the former support-zone around 1.3290 (61.8% expansion) to 1.3320 (78.6% retracement), which lines up with the March/June low (1.3315).
- At the same time, need a break//close below 1.3110 (50% expansion) to open up the Fibonacci overlap around 1.3030 (50% expansion) to 1.3040 (61.8% expansion), with the next area of interest coming in around 1.2950 (78.6% expansion) to 1.2980 (61.8% retracement), which lines up with the January low (1.2957).

--- Written by David Song, Currency Strategist
Follow me on Twitter at @DavidJSong


