


Canadian Dollar, USD/CAD, Bank of Canada, TSX Composite – Talking Points
- Canadian Dollar has been rising with medium-term bond yields
- USD/CAD downtrend faces next key barrier towards 2020 low
- TSX Composite eyeing March high, is upside momentum fading?
The Canadian Dollar has been on a winning streak against its G10 counterparts, excluding the Norwegian Krone. Might this trend continue, especially versus the US Dollar? A closer look shows that gains in CAD since late June have been coinciding with rising Canadian government bond yields on the far end of the curve. Those on the front end are being depressed by quantitative easing efforts from the Bank of Canada.
On the chart below, my majors-based Canadian Dollar index can be seen touching its highest in almost 3 weeks. This is as local 10-year and 30-year government bond yields reached their highest in over 2 months. The latter seem to be hinting at rising confidence in economic growth prospects in the medium term, perhaps eventually opening the door to a less-dovish BoC that would likely boost the appeal of the Canadian Dollar.

In fact the Canadian benchmark stock index, the TSX Composite, spent most of Wednesday trading lower after gapping higher. While it still ended the day +0.47%, it should be noted that rising medium-term borrowing cost expectations could act as a brake pedal for local equities. Still, in the short run, low interest rates and quantitative easing could keep market sentiment upbeat.
Medium-term government bond yields in the United States have also been rising. The US is Canada’s largest trading partner, with over 70% of local exports heading south across the border. Fiscal stimulus expectations in the former could imply a positive knock-on effect for the latter. Rising trade tensions are a risk however after US President Donald Trump announced the reintroduction of Canadian aluminum import tariffs on August 16.
Discover your trading personality to help find optimal forms of analyzing financial markets
Canadian Dollar Vs Local Government Bond Yields
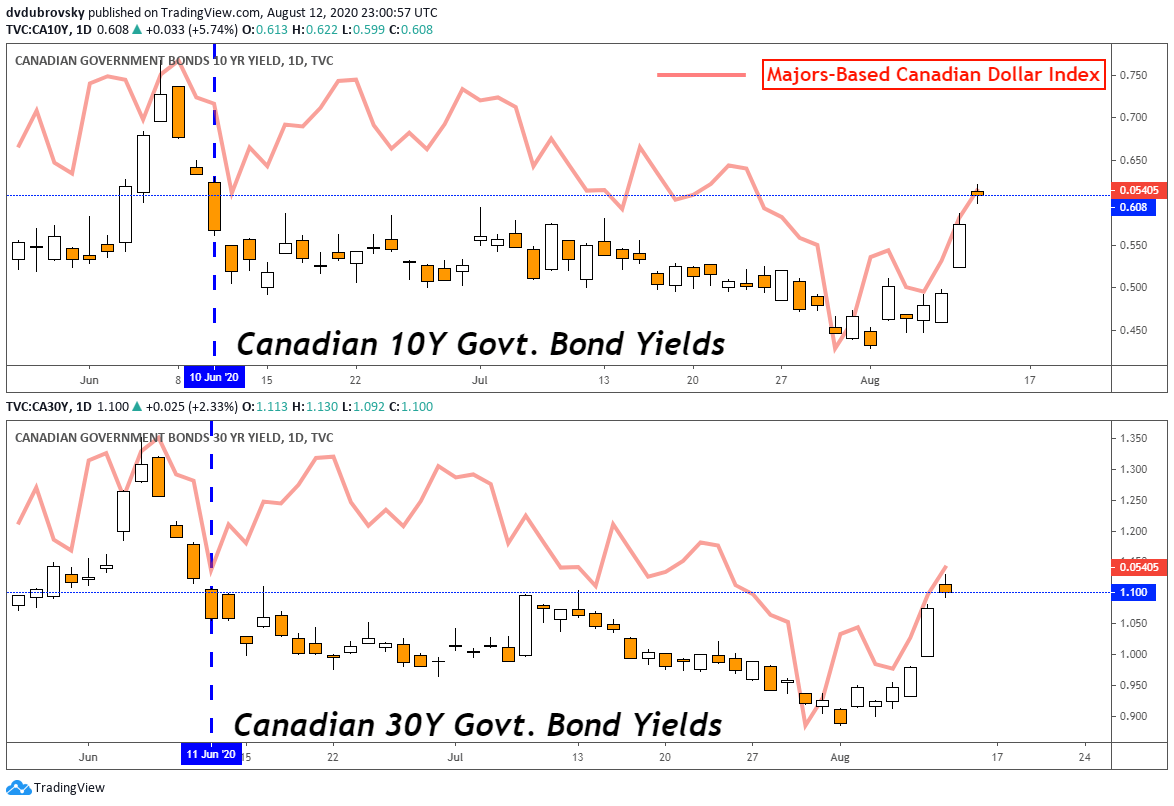
*Majors-Based Canadian Dollar Index Averages CAD Against USD, EUR, GBP and JPY
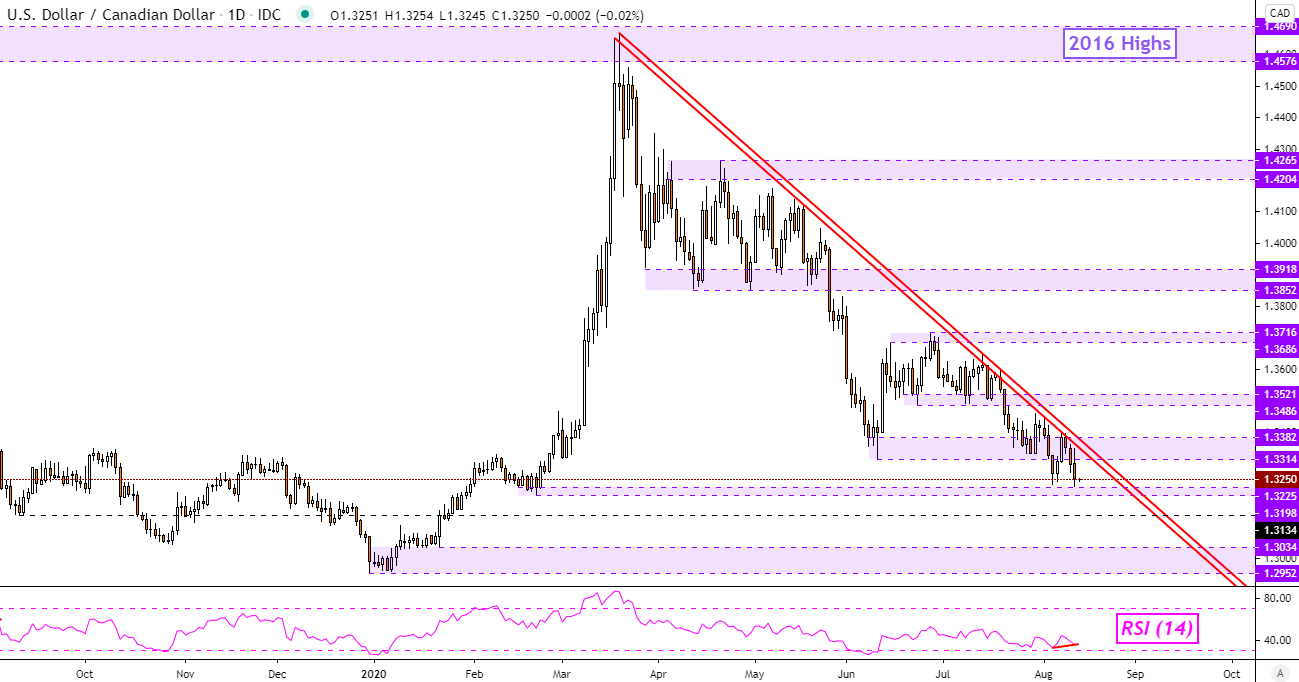
USD/CAD Technical Outlook
USD/CAD closed at its lowest since late February, surpassing early August lows as the dominant downtrend since late March continued. Guiding the pair lower is falling resistance, red parallel lines on the daily chart below.
Positive RSI divergence does show that downside momentum is fading, which can at times precede a turn higher. A push above resistance exposes the 1.3486 – 1.3521 inflection range. Otherwise, taking out 1.3198 opens the door to perhaps revisiting 2020 lows.
| Change in | Longs | Shorts | OI |
| Daily | -2% | 7% | 5% |
| Weekly | -30% | 38% | 13% |
USD/CAD - Daily Chart
TSX Composite Technical Outlook
The TSX Composite is fast approaching the 16816 inflection point, guided higher by rising support from late March. Breaching this technical barrier may open the door to testing 17230 on the way towards the all-time high. Negative RSI divergence does persist, showing fading upside momentum.
TSX Composite - Daily Chart

--- Written by Daniel Dubrovsky, Currency Analyst for DailyFX.com
To contact Daniel, use the comments section below or @ddubrovskyFX on Twitter


