


Gold Price Talking Points
The price of gold blasts through the psychologically important $2000 mark to tag a fresh record high ($2026), and the extreme reading in the Relative Strength Index (RSI) may continue to be accompanied by higher gold prices like the behavior seen earlier this year.
Gold Price Blasts Through $2000 to Mark Fresh Record High
The price of goldcontinues to trade to fresh yearly highs during every single month so far in 2020, and the bullish price action may persist over the remainder of the week as the extreme reading in the RSI coincide with the crowding behavior in the US Dollar.
The RSI sits in overbought territory for the third time in 2020 as bullion continues to exhibit a bullish behavior, and the price of gold may continue to push higher as long as the indicator holds above 70.
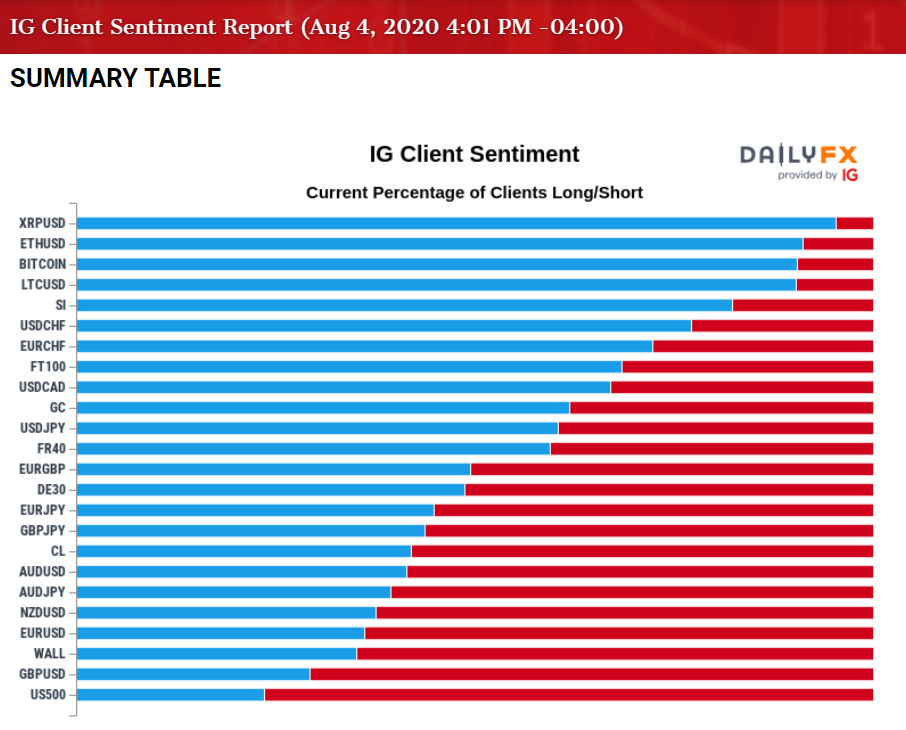
At the same time, the IG Client Sentiment report continues to show retail traders net-long USD/CHF, USD/CAD and USD/JPY, while the crowd remains net-short AUD/USD, NZD/USD, EUR/USD and GBP/USD even though the DXY index plummets for sixth consecutive weeks.
In turn, current market conditions may keep gold prices afloat as the Federal Reserve pledges to “increase our holdings of Treasury and agency mortgage-backed securities at least at the current pace,” and the depreciation in the US Dollar may keep the price of gold afloat as Chairman Jerome Powell and Co. appear to be on track to retain the current policy throughout the remainder of the year.
With that said, the extreme reading in the RSI along with the crowding behavior in the US Dollar may keep bullion afloat, and the low interest rate environment along with the ballooning central bank balance sheets may continue to act as a backstop for the price of gold as market participants look for an alternative to fiat-currencies.

Sign up and join DailyFX Currency Strategist David Song LIVE for an opportunity to discuss potential trade setups.
Gold Price Daily Chart
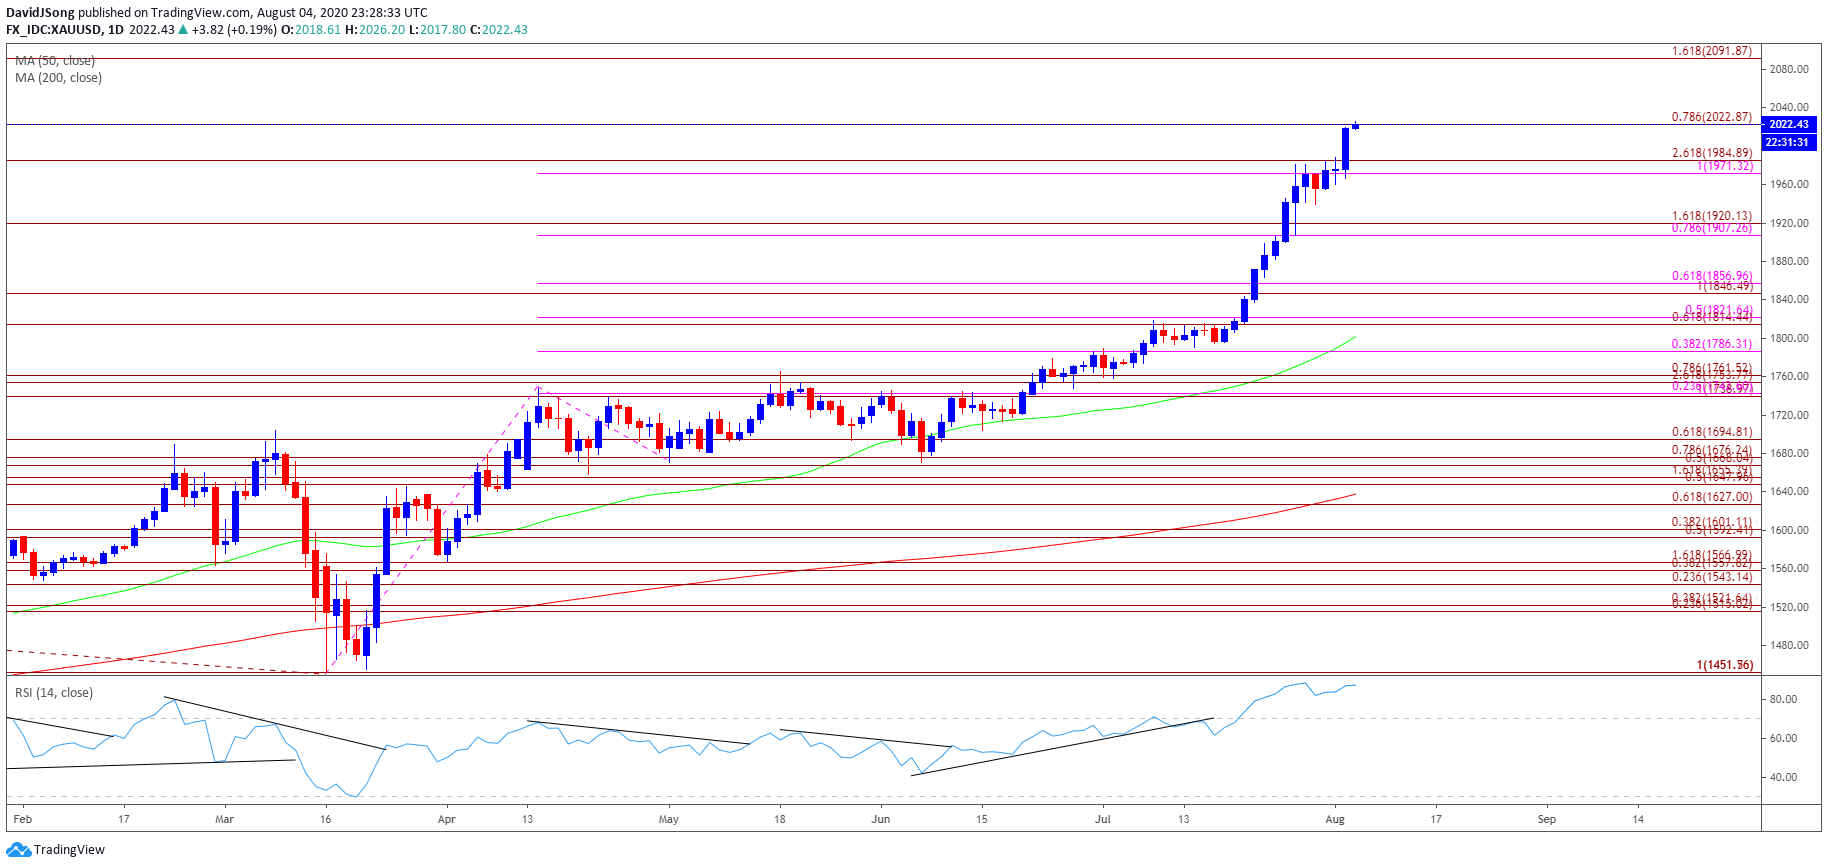
Source: Trading View
- The technical outlook for the price of gold remains constructive as it trades to fresh yearly highs during every single month so far in 2020, with the bullish behavior also taking shape in August as precious metal tags a new 2020 high ($2026).
- The price of gold cleared the previous record high price recorded in September 2011 ($1921) even though the Relative Strength Index (RSI) failed to retain the upward from June, but the indicator registered a new extreme reading (88) for 2020 as the oscillator pushed into overbought territory for the third time this year.
- The extreme reading in the RSI is likely to be accompanied by higher gold prices amid the price action seen in February, and the bullish behavior may persist as long as the indicator holds above 70.
- The break/close above the Fibonacci overlap around $1971 (100% expansion) to $1985 (261.8% expansion) has pushed the price of gold above the psychologically important $2000 mark, but need a closing price above the $2023 (78.6% expansion) area to bring the $2092 (161.8% expansion) region on the radar.

--- Written by David Song, Currency Strategist
Follow me on Twitter at @DavidJSong


