


EUR/USD Rate Talking Points
EUR/USD appears to be holding near the 2020 high (1.1781) as the Federal Reserve extends the duration of its lending programs to December 31, and current market conditions may keep the exchange rate afloat as the Relative Strength Index (RSI) sits in overbought territory.
EUR/USD Rate Eyes September 2018 High as RSI Sits in Overbought Zone
The technical outlook for EUR/USD remains constructive ahead of the Federal Open Market Committee (FOMC) interest rate decision as the bull flag formation highlighted the potential for a break above the March high (1.1495), with the RSI helping to validate the continuation pattern as the oscillator bounced along trendline support to preserve the upward trend from March.
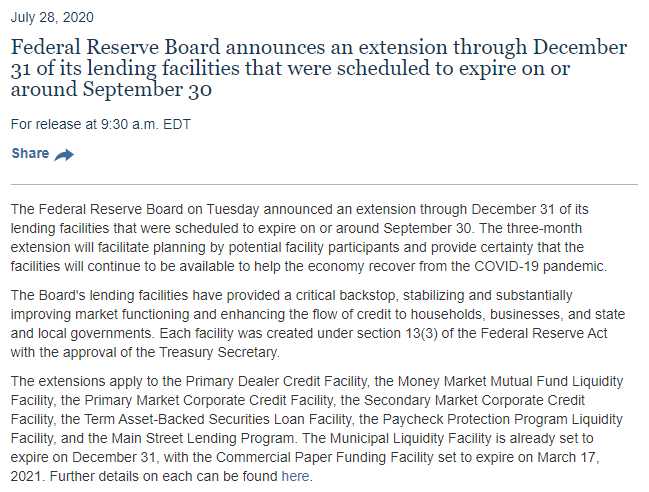
It remains to be seen if the extreme RSI reading will carry into August as EUR/USD fails to extend the series of higher highs and lows from the previous week, but more of the same from the FOMC may push the exchange rate towards the September 2018 high (1.1815) as the central bank announces “an extension through December 31 of its lending facilities that were scheduled to expire on or around September 30.”
Source: FOMC
The timing of the press release suggests the FOMC will continue to utilize its lending facilities along with its asset purchases to combat the economic shock from COVID-19, and Chairman Jerome Powell and Co. may retain a dovish forward guidance over the coming months as the central bank vows to “increase its holdings of Treasury securities and agency MBS (Mortgage-Backed Security) and agency CMBS (Commercial Mortgage-Backed Security) at least at the current pace.”
In turn, the crowding behavior in the US Dollar may also persist in the month ahead as the IG Client Sentiment report continues to show retail traders net-long USD/CHF, USD/CAD and USD/JPY, while the crowd remains net-short NZD/USD, GBP/USD, AUD/USD and EUR/USD.
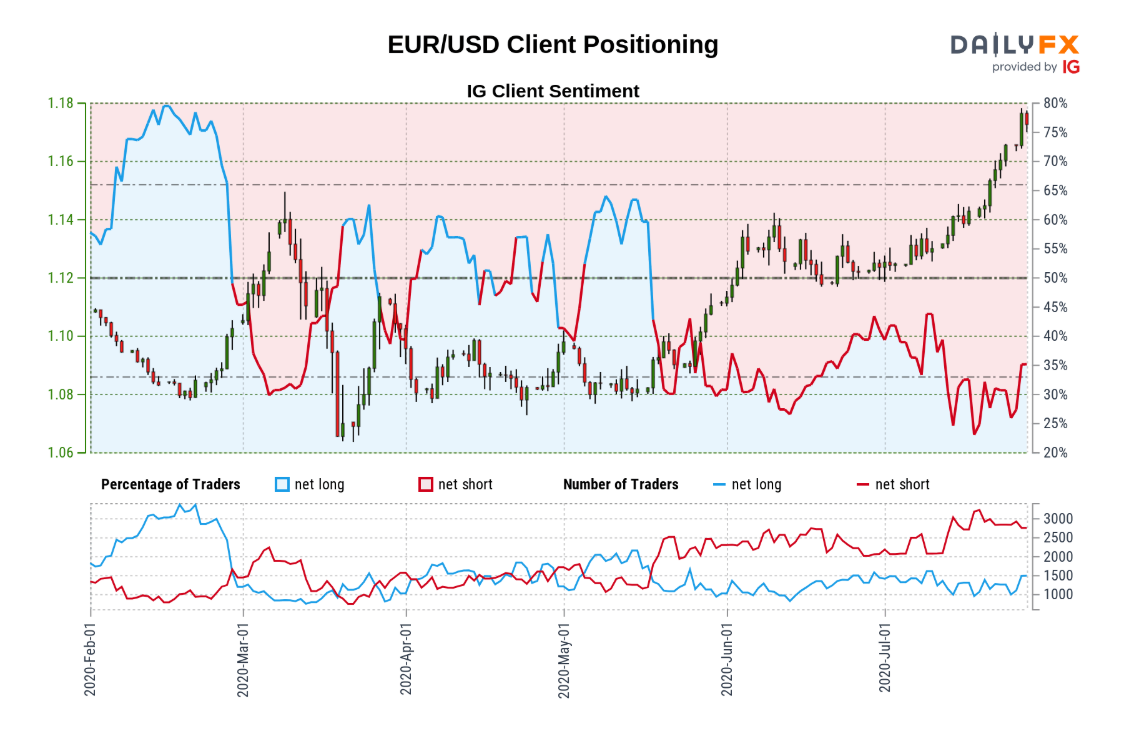
Retail traders have been net-short EUR/USD since mid-May, with the latest update showing 35.04% of tradersnet-long the pair as the ratio of traders short to long sits at 1.85 to 1. The number of traders net-long is 13.92% higher than yesterday and 24.14% higher from last week, while the number of traders net-short is 0.36% higher than yesterday and 4.18% lower from last week.
It seems as though the EUR/USD rally is fueling net-long interest as it clears the 2019 high (1.1570) in July, while the decline in net-short positions suggests stop-loss orders are being triggered as the exchange rate trades to a fresh yearly high (1.1781).
With that said, the crowding behavior in the US Dollar looks poised even though the Fed is expected to retain the current policy, and current market conditions may keep EUR/USD afloat as the RSI holds above 70.

Sign up and join DailyFX Currency Strategist David Song LIVE for an opportunity to discuss key themes and potential trade setups surrounding foreign exchange markets.
EUR/USD Rate Daily Chart

Source: Trading View
- Keep in mind, EUR/USD failed to test the March high (1.1495) in June amid the lack of momentum to break/close above the Fibonacci overlap around 1.1430 (23.6% expansion) to 1.1450 (50% retracement), with the Relative Strength Index (RSI) pulling back from overbought territory during the same period after triggering an extreme reading for the second time in 2020.
- Nevertheless, a ‘golden cross’ materializing towards the end of June as the 50-Day SMA (1.1295) crossed above the 200-Day SMA (1.1079), with the RSI bouncing along trendline support to retain the bullish trend from earlier this year.
- Will keep a close eye on the RSI as it triggers an overbought reading for the third time in 2020, with the bullish price action in EUR/USD likely to persist as long as the indicator holds above 70 amid the behavior seen in June.
- The bull flag formation panned out following the failed attempt to close below the 1.1190 (38.2% retracement) to 1.1220 (78.6% expansion) region in July, with the continuation pattern producing a break of the 2019 high (1.1570).
- The break/close above the 1.1670 (50% retracement) to 1.1710 (61.8% retracement) region brings the Fibonacci overlap around 1.1810 (61.8% retracement) to 1.1850 (100% expansion) on the radar as it lines up with the September 2018 high (1.1815), with the next area of interest coming in around 1.1960 (38.2% retracement) to 1.1970 (23.6% expansion).

--- Written by David Song, Currency Strategist
Follow me on Twitter at @DavidJSong


