


Euro Talking Points
The technical outlook for EUR/USD brings the 2020 high (1.1495) on the radar as a bull flag formation unfolds, with the continuation pattern materializing as the Relative Strength Index (RSI) extends the bullish trend from earlier this year.
Technical Forecast for Euro: Bullish
Key indicators instilled a bullish outlook for EUR/USD ahead of the second half of the year as a ‘golden cross’ emerged towards the end of June, with the 50-Day SMA (1.1172) and 200-Day SMA (1.1058) still tracking a positive slope following the bullish signal.
In turn, a bull flag formation appears to be unfolding as EUR/USD takes out the June high (1.1423), and the bullish momentum may gather pace over the coming days as the RSI rebounds from trendline support and continues to track the upward trend from earlier this year.
Will keep a close eye on the RSI as it approaches 70, with another overbought reading likely to be accompanied by a further advance in EUR/USD amid thebullish behavior seen in June.
EUR/USD Rate Daily Chart
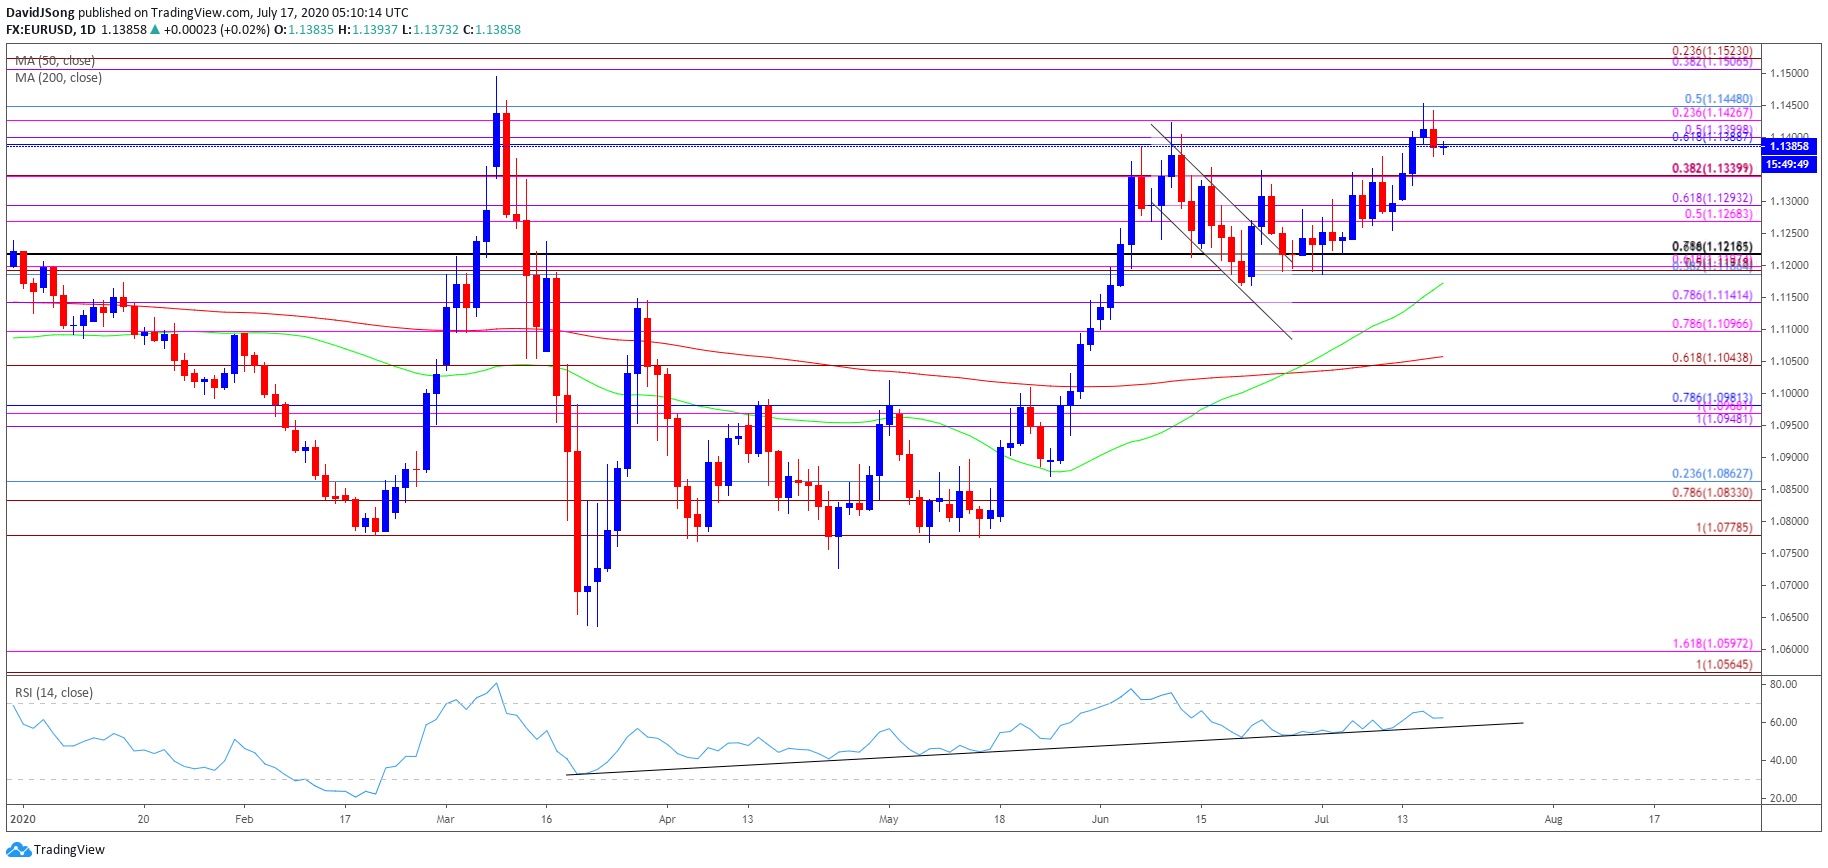
Source: Trading View
Keep in mind, EUR/USD failed to test the March high (1.1495) in June amid the lack of momentum to break/close above the Fibonacci overlap around 1.1430 (23.6% expansion) to 1.1450 (50% retracement), with the Relative Strength Index (RSI) pulling back from overbought territory during the same period after triggering an extreme reading for the second time in 2020.
Nevertheless, a bull flag formation appears to be unfolding amid failed attempt to close below the 1.1190 (38.2% retracement) to 1.1220 (78.6% expansion) region in July, with the continuation pattern bringing the 2020 high (1.1495) on the radar as EUR/USD takes out the June high (1.1423). At the same time, the RSI may show the bullish momentum gathering pace as it continues to track the upward trend from earlier this year, with another break above 70 to mark the third overbought reading for 2020.
Need a closing price above the Fibonacci overlap around 1.1430 (23.6% expansion) to 1.1450 (50% retracement) to open up the March high (1.1495), which largely aligns with the 1.1510 (38.2% expansion) to 1.1520 (23.6% retracement) region.
--- Written by David Song, Currency Strategist
Follow me on Twitter at @DavidJSong


