


Gold Price Talking Points
The price of gold struggles to retain the advance from earlier this week ahead of the US Non-Farm Payrolls (NFP) report, but the precious metal may stage another attempt to test the 2012 high ($1796) as the Relative Strength Index (RSI) breaks out of a negative slope.
Gold Price Levels to Watch Ahead of US Non-Farm Payrolls (NFP) Report
The price of gold has traded to fresh yearly highs during every single month so far in 2020, and the precious metal may continue to exhibit a bullish behavior in June as the pullback from the yearly high ($1765) reverses ahead of the May low ($1670).
Nevertheless, the fresh update to the US NFP report may shake up the near-term outlook for bullion as employment is expected to decline 4.25M in May following the 20.5M contraction the month prior, and it remains to be seen if the data will influence the monetary policy outlook as the Federal Reserve prepares to have the Municipal Liquidity Facility along with the Main Street Lending Program up and running in June.
The new set of non-standard measures may ultimately push the Federal Open Market Committee (FOMC) to the sidelines as the balance sheet climbs above $7 trillion in May, and the central bank may carry out a wait-and-see approach over the coming months as ChairmanJerome Powelltames speculation for a negative interest rate policy (NIRP).
In turn, the FOMC may merely attempt to buy time at its next interest rate decision on June 10 as Fed officials express mixed views regarding the US economy, but the committee may continue to endorse a dovish forward guidance as the central bank remains committed in “using its full range of tools to support the U.S. economy in this challenging time.”
With that said, the low interest rate environment along with the ballooning central bank balance sheets may continue to act as a backstop for goldas marketparticipants look for an alternative to fiat-currencies, and the precious metal may stage another attempt to test the 2012 high ($1796) as the Relative Strength Index (RSI) breaks out of a bearish formation.

Sign up and join DailyFX Currency Strategist David Song LIVE for an opportunity to discuss potential trade setups.
Gold Price Daily Chart
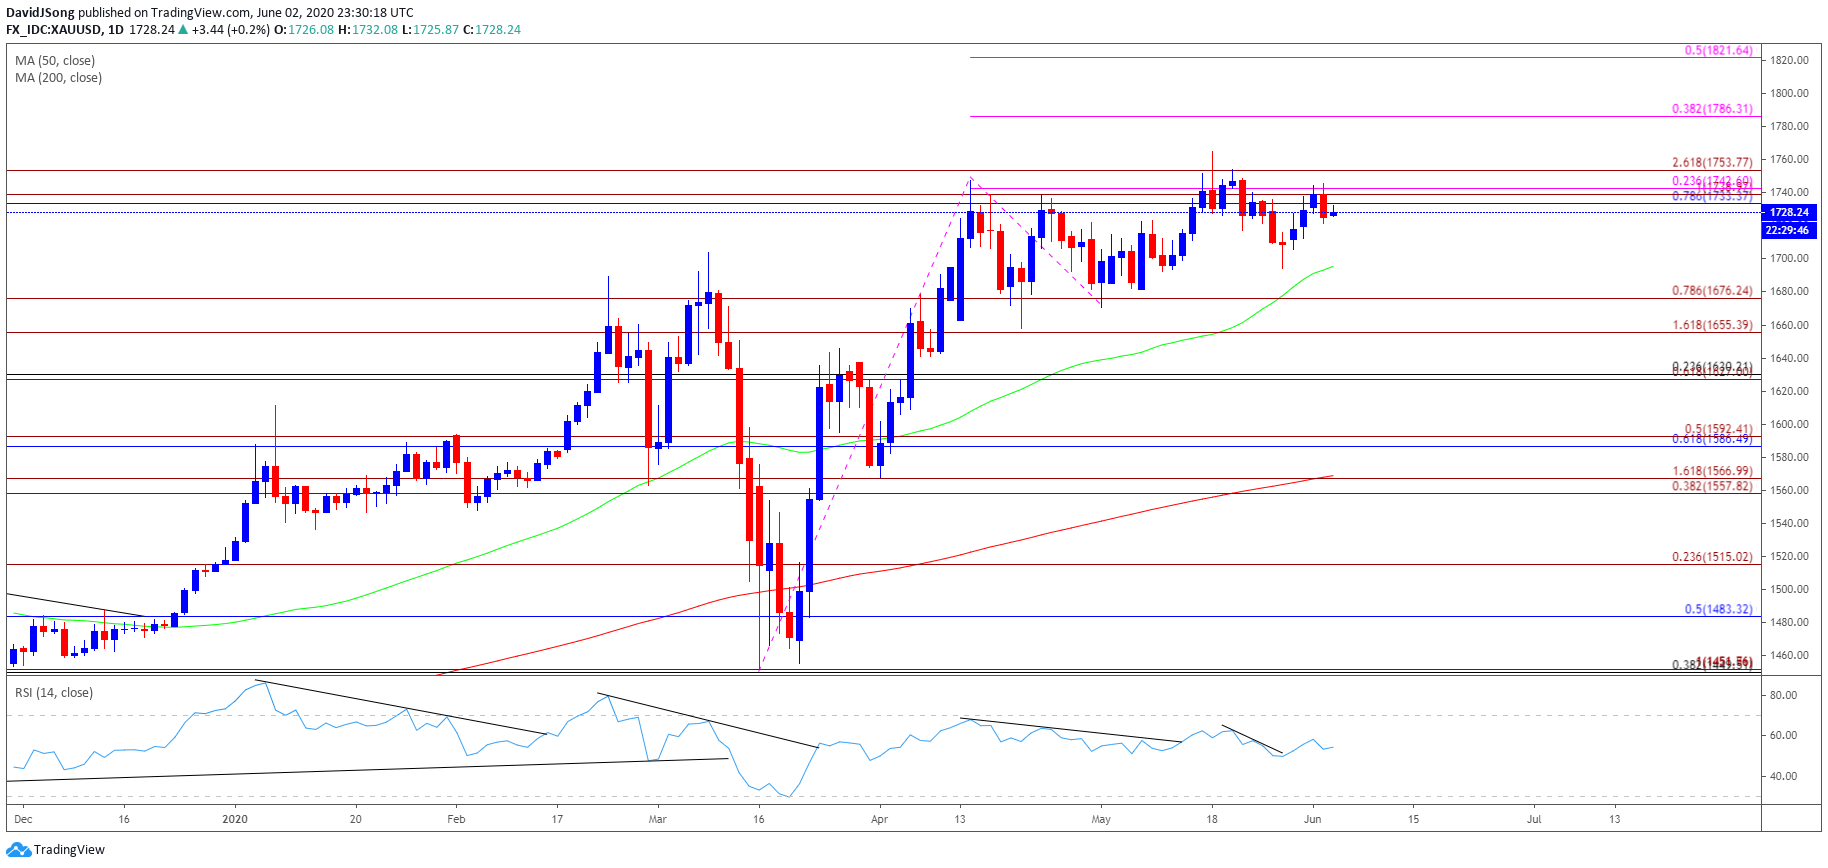
Source: Trading View
- The opening range for 2020 instilled a constructive outlook for the price of gold as the precious metal cleared the 2019 high ($1557), with the Relative Strength Index (RSI) pushing into overbought territory during the same period.
- A similar scenario materialized in February, with the price of gold marking the monthly low ($1548) during the first full week, while the RSI broke out of the bearish formation from earlier this year to push back into overbought territory.
- However, the monthly opening range for March as less relevant amid the pickup in volatility, with the decline from the monthly high ($1704) leading to a break of the January low ($1517).
- Nevertheless, the reaction to the former-resistance zone around $1450 (38.2% retracement) to $1452 (100% expansion) instilled a constructive outlook for bullion especially as the RSI reversed course ahead of oversold territory and broke out of the bearish formation from February.
- In turn, gold cleared the March high ($1704) to tag a new yearly high ($1748) in April, with the bullish behavior also taking shape in May as the precious metal traded to a fresh 2020 high ($1765).
- The bullish behavior may persist in June as the price of gold reverses ahead of the May low ($1670), with the RSI highlighting a similar dynamic as the indicator breaks out of the negative slope from the previous month.
- Need a close above the Fibonacci overlap around $1733 (78.6% retracement) to $1743 (23.6% expansion) to open up the $1754 (261.8% expansion) region, with the next area of interest coming in around $1786 (38.2% expansion) followed by the 2012 high ($1796).

--- Written by David Song, Currency Strategist
Follow me on Twitter at @DavidJSong


