


Gold Talking Points
Gold remains under pressure following the U.S. mid-term election, with the price for bullion slipping to a fresh monthly-low ($1204), and the precious metal stands at risk of extending the recent series of lower highs & lows as the Relative Strength Index (RSI) flashes a bearish signal.
Gold Price Outlook Mired by Lower Highs & Lows, Bearish RSI Signal
Developments coming out of the U.S. economy may continue to sap the appeal of gold even though the Federal Reserve keeps the benchmark interest rate on hold in November as there appears to be little in the way of derailing the central bank from its hiking-cycle.
Looking ahead, a slew of Fed officials are slated to speak over the coming days, with Dallas Fed President Robert Kaplan hosting Chairman Jerome Powell for a discussion on national and global economic issues, and members of the Federal Open Market Committee (FOMC) may ultimately prepare households and businesses for an imminent rate-hike ahead of its last 2018-meeting in December as the central bank fulfils its dual mandate for full-employment and price stability.
However, the ongoing shift in U.S. trade policy may push the FOMC to extend the hiking-cycle as ‘several participants reported that firms in their Districts that were facing higher input prices because of tariffs perceived that they had an increased ability to raise the prices of their products,’ and a growing number of Fed officials may show a greater willingness to implement above-neutral interest rates in order to keep inflation around the symmetric 2% target.
In turn, speculation for higher U.S. interest rates fosters a long-term bearish outlook for bullion especially as the dollar appreciates against its major counterparts, but sentiment surrounding the precious metal remains skewed, with recent developments warning of range-bound conditions as retail traders fade the stickiness in gold prices.
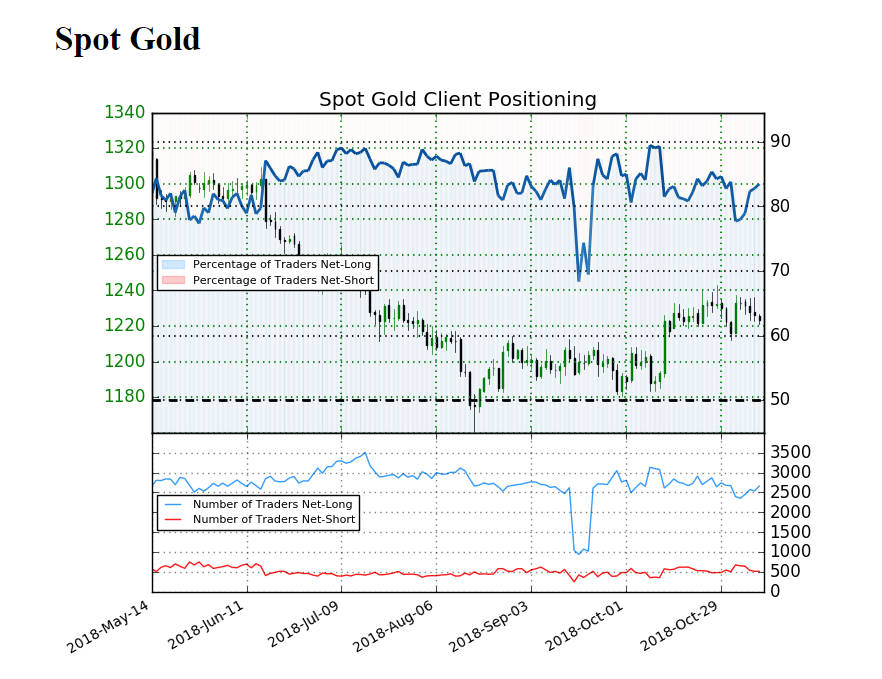
The IG Client Sentiment Report shows 83.5% of traders are now net-long gold compared to 78.7% during the prior week, with the ratio of traders long to short at 5.06 to 1. The number of traders net-long is 6.1% higher than yesterday and 1.3% lower from last week, while the number of traders net-short is 5.2% lower than yesterday and 7.3% higher from last week.
The persistent tilt in retail position undermines the rebound from the 2018-low ($1160) as it offers a contrarian view to crowd sentiment, but a further pickup in net-shorts may give way to range-bound conditions as retail traders appear to be fading the stickiness in gold. Sign up and join DailyFX Currency Analyst David Song LIVE for an opportunity to discuss potential trade setups.
Gold Daily Chart
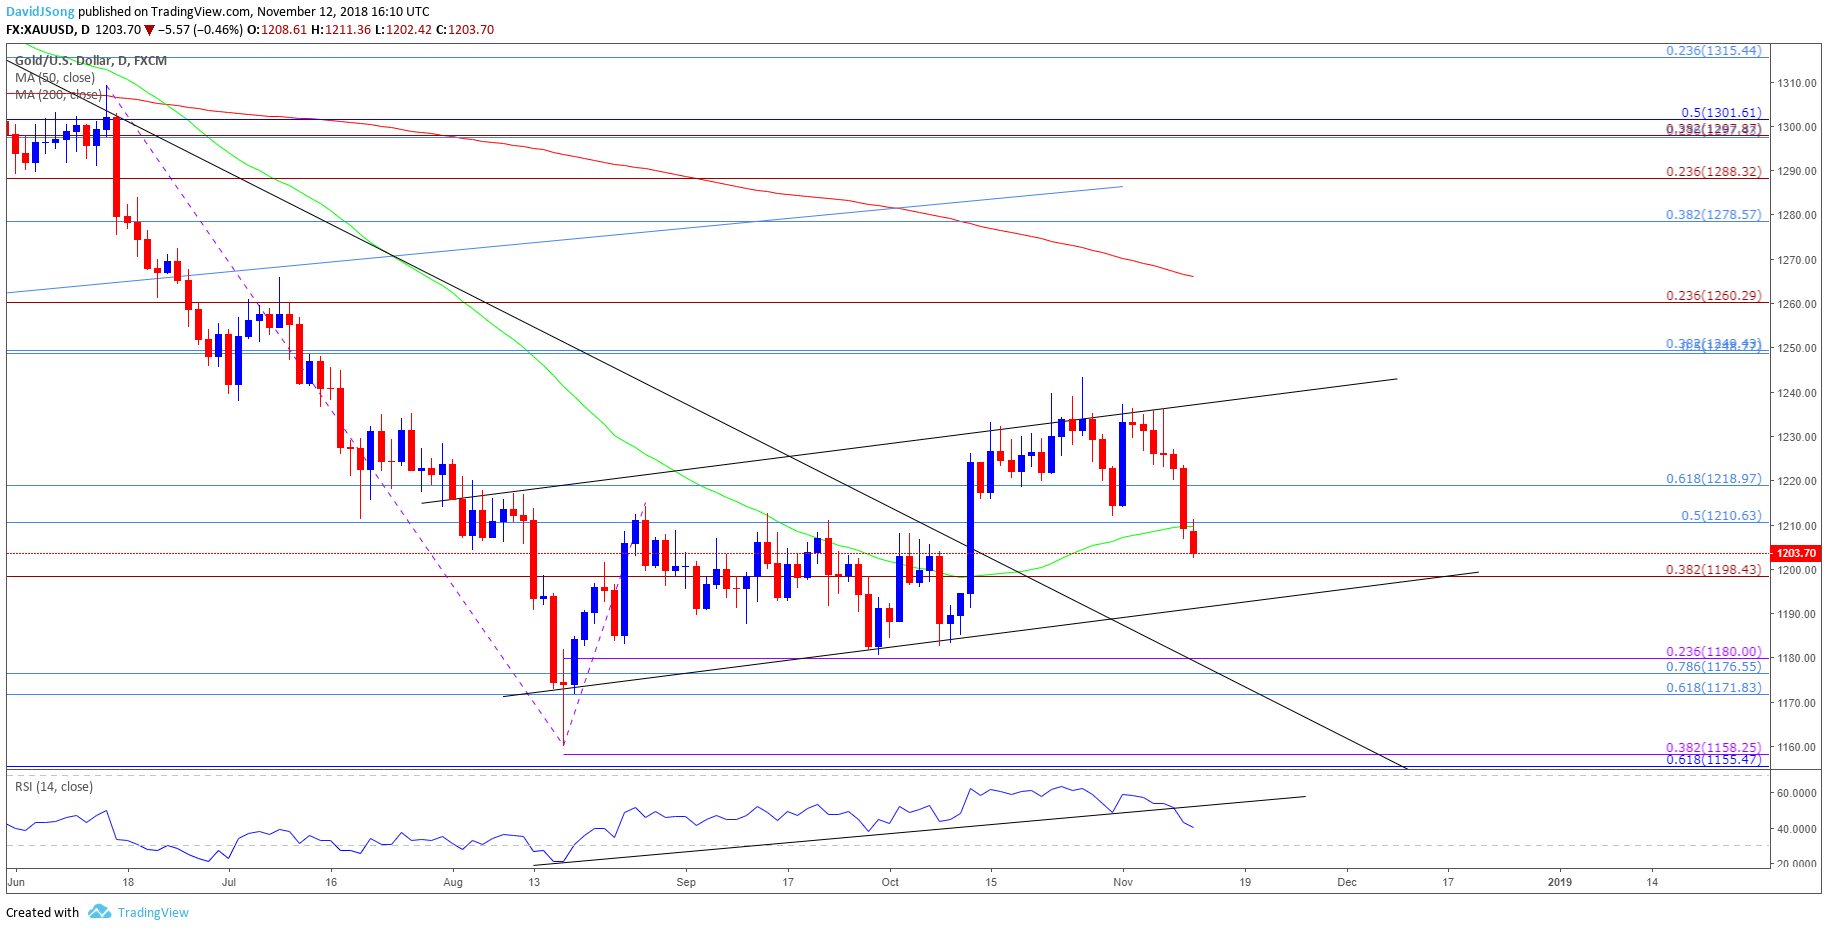
- Keep in mind, the broader outlook for gold is no longer bearish as it breaks out of the downward trend from earlier this year, but the lack of momentum to hold above the former-resistance zone around $1210 (50% retracement) to $1219 (61.8% retracement) may keep bullion under pressure especially as the Relative Strength Index (RSI) snaps the bullish formation carried over from August.
- In turn, the $1198 (38.2% expansion) region now sits on the radar, with a break/close below the stated region raising the risk for a move back towards the September-low ($1181).
- Need a break/close below the $1172 (61.8% retracement) to $1180(23.6% expansion) region to open up the 2018-low ($1160), which lines up with the Fibonacci overlap around $1156 (61.8% retracement) to $1158 (38.2% expansion).
For more in-depth analysis, check out the Q4 Forecast for Gold
Additional Trading Resources
Are you looking to improve your trading approach? Review the ‘Traits of a Successful Trader’ series on how to effectively use leverage along with other best practices that any trader can follow.
Want to know what other markets the DailyFX team is watching? Download and review the Top Trading Opportunities for 2018.
--- Written by David Song, Currency Analyst
Follow me on Twitter at @DavidJSong.


