


Talking Points:
- GBP/USD Outlook Mired by Weak U.K. Data, Mixed BoE Rhetoric.
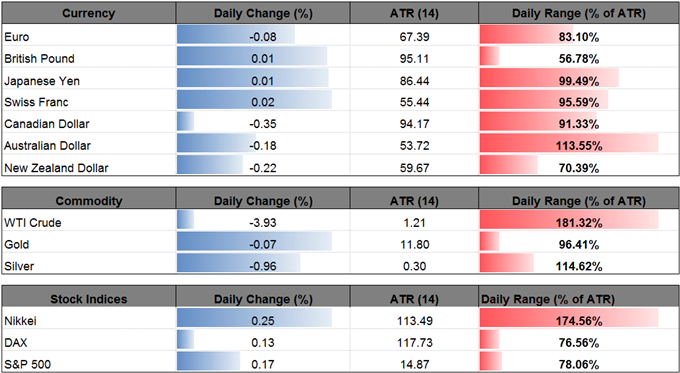
- Crude Oil Snaps Bullish Sequence Ahead of EIA Inventory Update.
| Ticker | Last | High | Low | Daily Change (pip) | Daily Range (pip) |
|---|---|---|---|---|---|
| GBP/USD | 1.2921 | 1.2948 | 1.2894 | 1 | 54 |
Dismal prints coming out of the U.K. economy paired with mixed rhetoric from Bank of England (BoE) officials may continue to suppress the broader outlook for GBP/USD as the Federal Open Market Committee (FOMC) appears to be on course to further normalize monetary policy over the coming months.
After voting to raise the benchmark interest rate in June, Ian McCafferty and Michael Saunders may continue to push for a 25bp-hike at the next meeting on August 3 ‘since then the economy has not slowed to the extent we feared it would last summer.’ However, with Silvana Tenreyro due to replace Kristen Forbes, the new MPC member may largely side with the majority, and the central bank doves may merely attempt to buy more time especially as Gertjan Vlieghe argues ‘a premature hike would be a bigger mistake than one that turns out to be slightly late.’
GBP/USD Daily

Chart - Created Using Trading View
- The failed attempt to test the May-high (1.3048) may open up the downside targets as GBP/USD extends the series of lower highs & lows from the previous week, with a break/close below the 1.2860 (61.8% retracement) hurdle opening up the next downside region of interest around 1.2630 (38.2% expansion) to 1.2680 (50% retracement) followed by the 200-Day SMA (1.2552).
- However, the Relative Strength Index (RSI) highlights the risk for range-bound conditions as the oscillator breaks out of the bearish formation from May, with the pound-dollar exchange rate largely capped by the Fibonacci overlap around 1.3090 (38.2% retracement) to 1.3120 (78.6% retracement).
Have a question about the currency markets? Join a Trading Q&A webinar and ask it live!
| Ticker | Last | High | Low | Daily Change ($) | Daily Range ($) |
|---|---|---|---|---|---|
| USOIL | 45.28 | 47.21 | 45.09 | 1.77 | 2.12 |
Failure to preserve the recent series of higher highs & lows may curb the near-term recovery in crude oil prices as the rebound appears to be stalling ahead of the June-high (49.14).
Nevertheless, the updated inventory figures coming out of the Energy Information Administration (EIA) may prop up oil prices as stockpiles are expected to contract 2500K in the week ending June 30. Signs of strong consumption accompanied by another decline in monthly outputs may spark a bullish reaction, but the broader outlook for crude remains tilted to the downside as U.S. production moves back towards the fastest pace of growth since 1970.
USOIL Daily
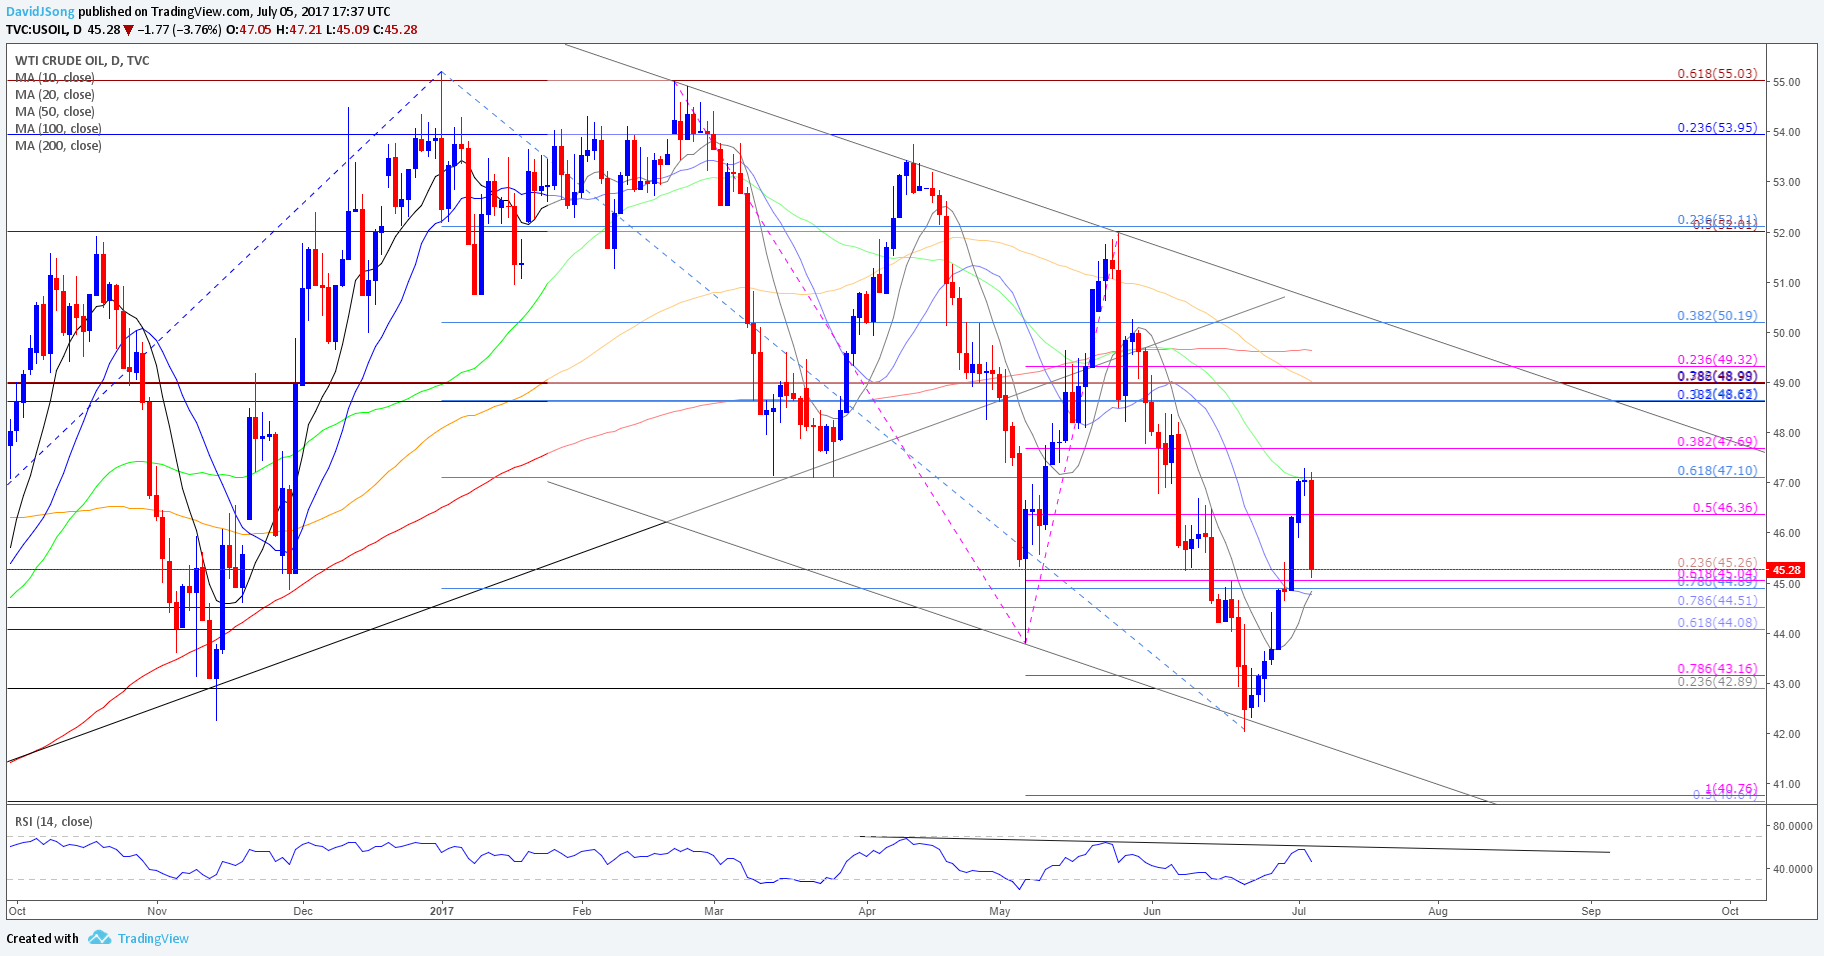
Chart - Created Using Trading View
- Broader outlook remains tilted to the downside as price & the Relative Strength Index (RSI) preserve the bearish formations from earlier this year, and the rebound from the 2017-low ($42.03) may slowly unravel as crude snaps the bullish sequence carried over from the previous month.
- Will keep a close eye on the monthly/quarterly opening range as oil prices struggle to clear the topside hurdle around $47.10 (61.8% retracement) to $47.60 (38.2% expansion), while the RSI appears to be turning around ahead of trendline resistance.
- A close below $46.40 (50% expansion) raises the risk for a move back towards the Fibonacci overlap around $44.90 (78.6% retracement) to $45.30 (23.6% expansion), with the next area of interest coming in around $44.10 (61.8% retracement) to $44.50 (78.6% retracement).
Make Sure to Check Out the DailyFX Guides for Additional Trading Ideas.

Check Out the New Gauge Developed by DailyFX Based on Trader Positioning
- Retail trader data shows 38.4% of traders are net-long GBP/USD with the ratio of traders short to long at 1.61 to 1. In fact, traders have remained net-short since June 23 when GBP/USD traded near 1.26787; price has moved 1.9% higher since then. The number of traders net-long is 6.1% higher than yesterday and 10.7% lower from last week, while the number of traders net-short is 4.6% lower than yesterday and 12.8% higher from last week.
- Retail trader data shows 68.2% of traders are net-long with the ratio of traders long to short at 2.14 to 1. In fact, traders have remained net-long since Apr 19 when Oil - US Crude traded near 5249.7; price has moved 13.3% lower since then. The number of traders net-long is 4.7% lower than yesterday and 34.0% lower from last week, while the number of traders net-short is 7.7% lower than yesterday and 23.7% higher from last week.
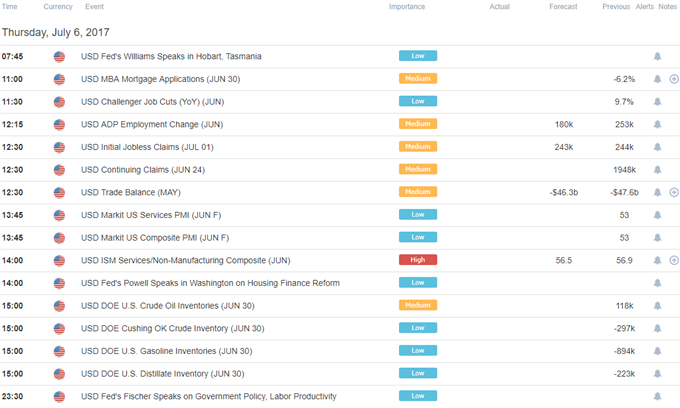
Click Here for the DailyFX Calendar
--- Written by David Song, Currency Analyst
To contact David, e-mail dsong@dailyfx.com. Follow me on Twitter at @DavidJSong.
To be added to David's e-mail distribution list, please follow this link.


