


Talking Points:
- GBP/USD Retail Sentiment Most Extreme Since Last Summer Ahead of U.K. GDP.
- USDOLLAR Extends Losses as Mixed Data Persists Ahead of Fed Meeting.
Avoid the pitfalls of trading by steering clear of classic mistakes. Review these principles in the "Traits of Successful Traders" series.
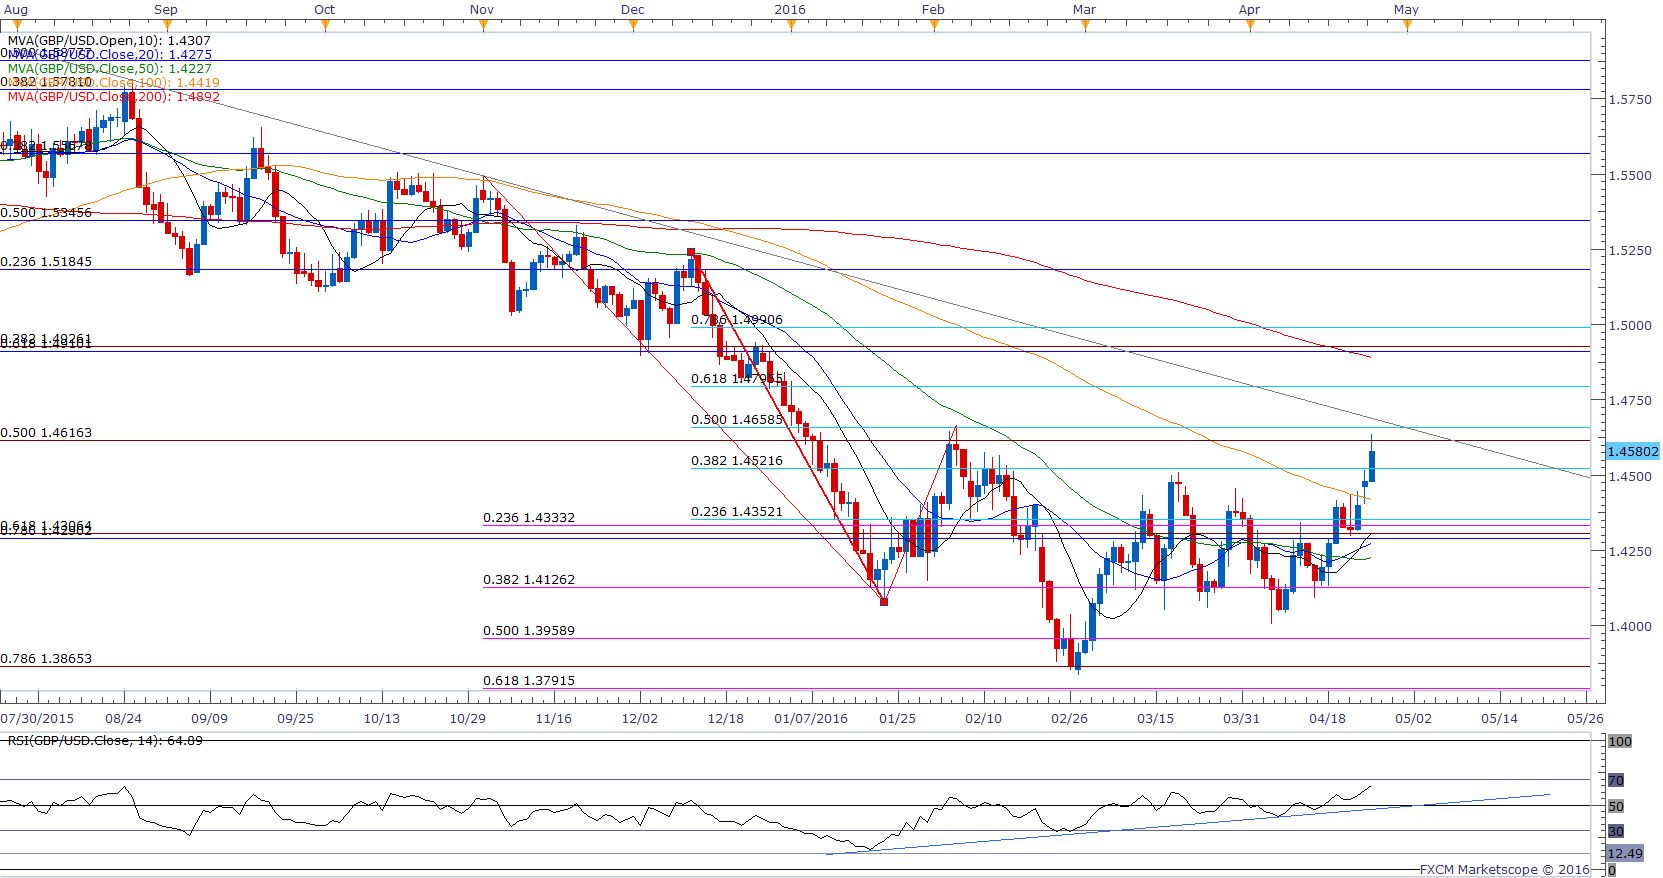
Chart - Created Using FXCM Marketscope 2.0
- Despite the gap higher to start the week, GBP/USD may ultimately test the downward trend from August 2015 as it breaks above the March high (1.4514) and approaches the February high (1.4668), while the Relative Strength Index (RSI) preserves the bullish momentum from earlier this year.
- However, the U.K’s Gross Domestic Product (GDP) report may produce near-term headwinds for the sterling as growth rate is anticipated to slow to an annualized 2.0% following the 2.1% expansion during the last three-months of 2015.
- Need a break/close above 1.4620 (50% expansion) to 1.4660 (50% retracement) to favor a further advance in the exchange rate.
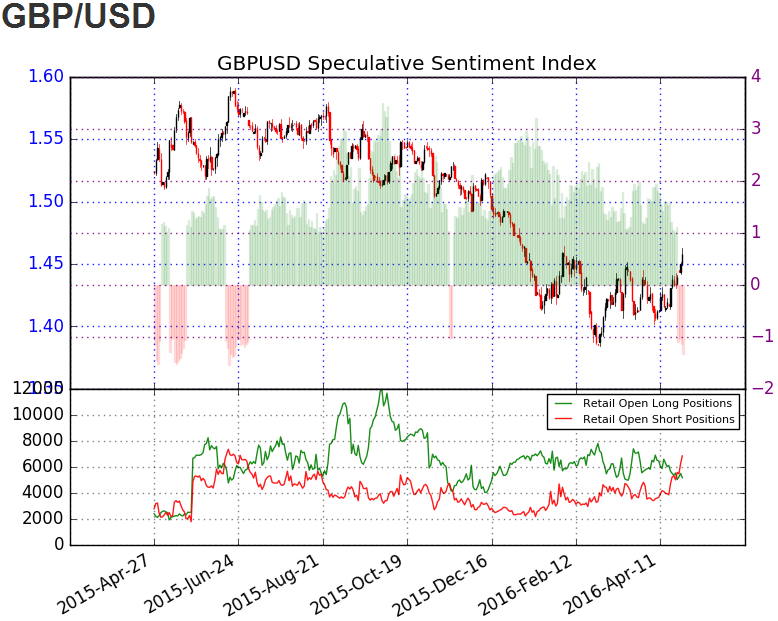
- The DailyFX Speculative Sentiment Index (SSI) shows the retail FX crowd flipped net-short GBP/USD on April 22, with the ratio approaching the extreme readings from last summer as it slipped towards -1.50.
- The ratio currently stands at -1.32 as 43% of traders are long, with short positions increasing 22.4% from the previous week, while open interest stands 16.7% above the monthly average.
Why and how do we use the SSI in trading? View our video and download the free indicator here
USDOLLAR(Ticker: USDollar):
| Index | Last | High | Low | Daily Change (%) | Daily Range (% of ATR) |
|---|---|---|---|---|---|
| DJ-FXCM Dollar Index | 11837.91 | 11860.41 | 11803.44 | -0.18 | 101.17% |
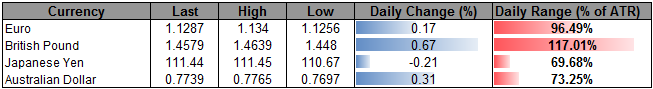
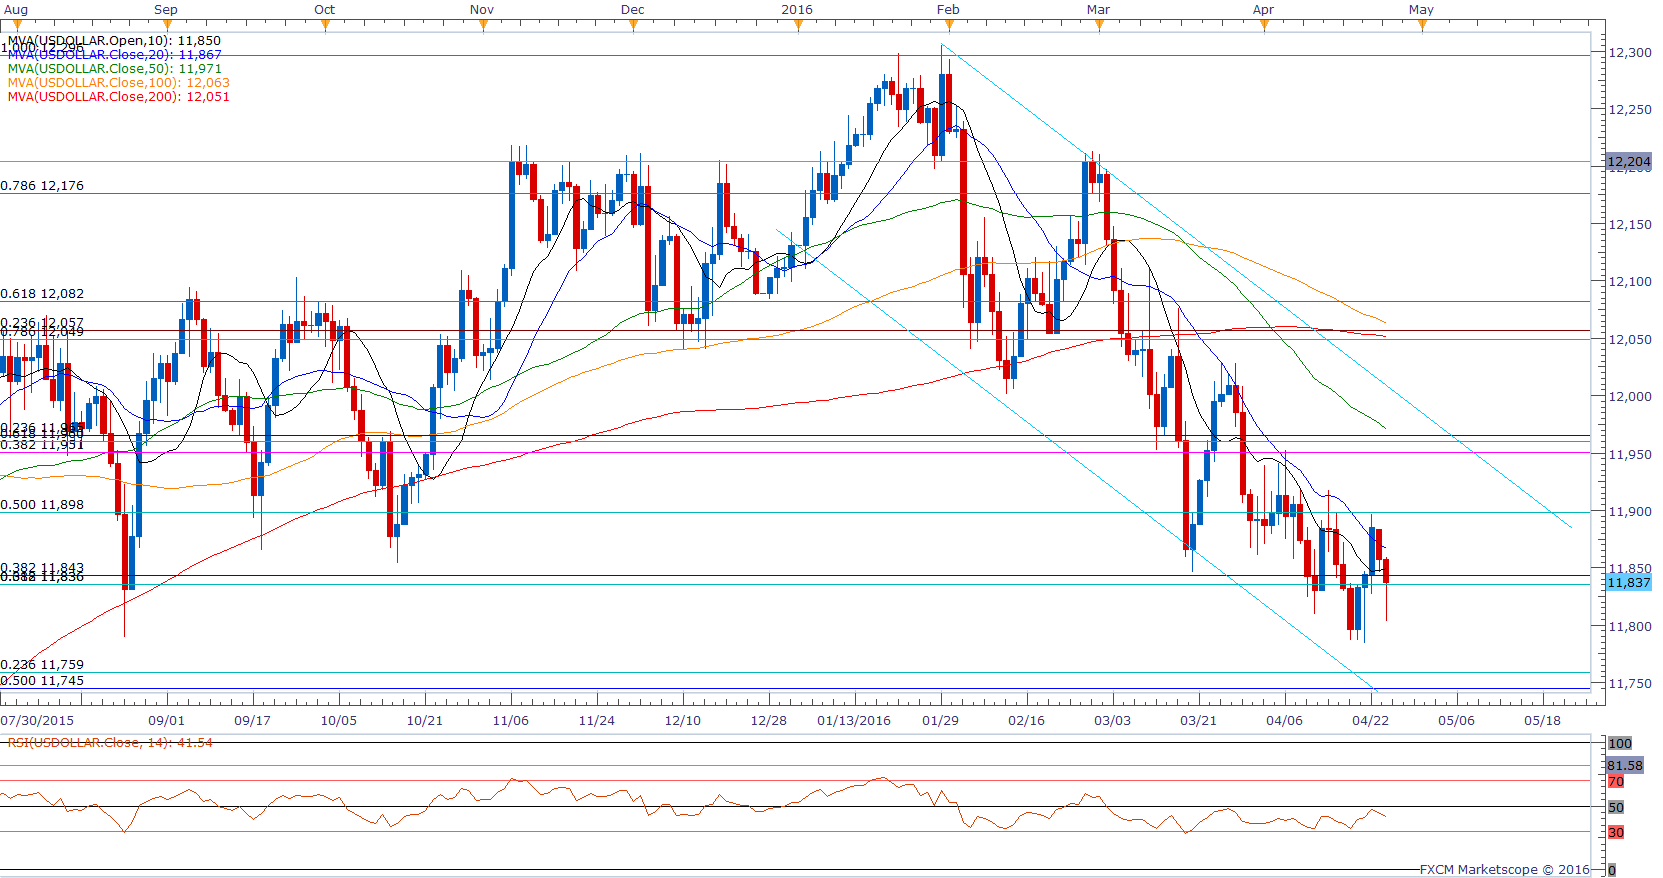
Chart - Created Using FXCM Marketscope 2.0
- The USDOLLAR extends the decline from earlier this week as the mixed data prints coming out of the U.S. economy undermine Fed expectations for a ‘consumer-led’ recovery; may see the greenback face additional headwinds over the coming days should the Federal Open Market Committee (FOMC) try to buy more time.
- However, following the 9 to 1 split at the March meeting, a growing dissent within the central bank accompanied by a greater willingness to implement higher borrowing-costs in the firs-half of 2016 may prop up the dollar as it boosts interest-rate expectations.
- Even though the Fed remains on course to further normalize monetary policy, the recent series of lower highs & lows raises the risk for a further decline in the USDOLLAR, with 11,745 (50% retracement) to 11,759 (23.6% retracement) on the radar.
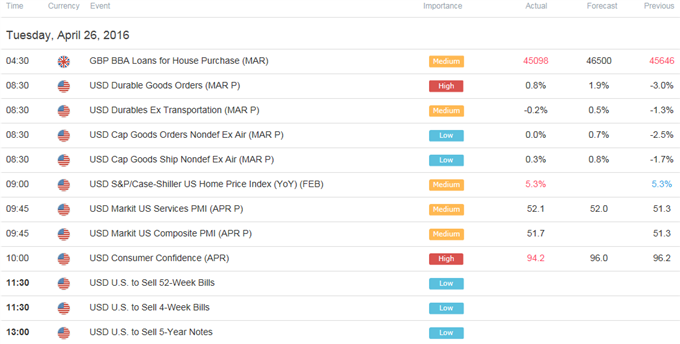
Click Here for the DailyFX Calendar
Read More:
Emotions Run High in Silver Trade
SPX500 Technical Analysis: Higher-Low Ahead of US Earnings
US DOLLAR Technical Analysis: Who’s Happier? Bears or Central Bankers
AUD/USD – Will the Real Trend Please Stand Up?
Get our top trading opportunities of 2016 HERE
--- Written by David Song, Currency Analyst
To contact David, e-mail dsong@dailyfx.com. Follow me on Twitter at @DavidJSong.
To be added to David's e-mail distribution list, please follow this link.
Trade Alongsidethe DailyFX Team on DailyFX on Demand


