


S&P 500 | Weak Start as Fed Hawks Return
US equities are off to a soft start to the year, with the benchmark S&P 500 slipping some 1.6%. As we stated in our Q1 equity forecast, now that we have seen a hawkish Fed pivot similar to that of 2018, Fed policy is now a bigger threat to equities than Omicron. This week saw a much more hawkish than expected minutes release from the Federal Reserve, whereby the central bank has quickly brought back quantitative tightening into the equation. Participants agreed that the balance sheet could shrink much sooner (closer to rate lift-off) and faster than last time. For those who remember the last time the Fed unwound the balance sheet in 2018, it was a tough time for risk appetite (figure.1).
Figure. 1 S&P 500 Struggled During QT
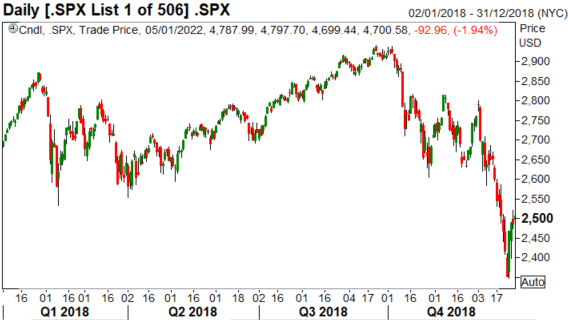
Source: Refinitiv
That being said, in the short run, after today’s jobs report, in which despite a softer headline, although, keep in mind the headline has been revised higher, every much since April 2021. The unemployment rate fell below 4%, while the average earnings surprised on the upside and as such, the data reinforces the view that the labour market is tight. Going forward, eyes will be on the inflation report and should we see an upside surprise, it is likely markets will fully price in a March rate hike.
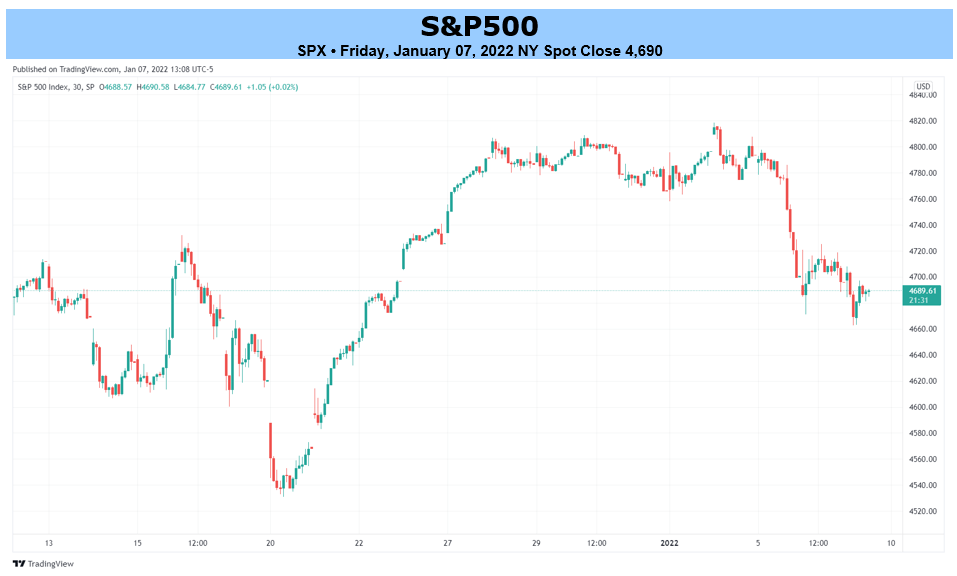
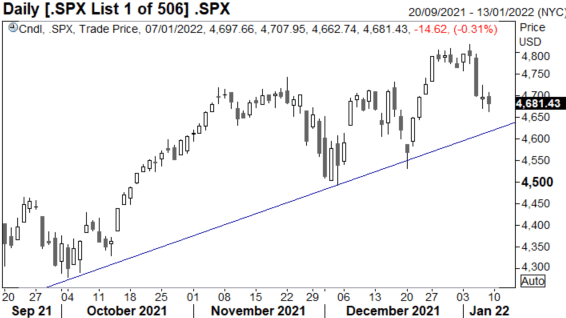
Looking at the chart, key support is situated at the rising trendline (circa 4620-40), which held at the back end of 2021. Remember that markets continue to display a buy the dip mentality and should we see a notably softer close Friday and Monday, there is a good chance of a turnaround Tuesday (much like Dec 20th).
S&P 500 Chart: Daily Time Frame
| Change in | Longs | Shorts | OI |
| Daily | 1% | -1% | 0% |
| Weekly | 15% | -13% | -1% |
RESOURCES FOR TRADERS
Whether you are a new or experienced trader, we have several resources available to help you; indicator for tracking trader sentiment, quarterly trading forecasts, analytical and educational webinars held daily, trading guides to help you improve trading performance, and one specifically for those who are new to forex.


