


Stocks Fundamental Forecast: Bullish
- Dow Jones, S&P 500, Nasdaq 100 fell but the bull market remained
- Stocks do tend to be more volatility in higher inflationary periods
- Fed policymakers may continue reiterating transitory price outlook

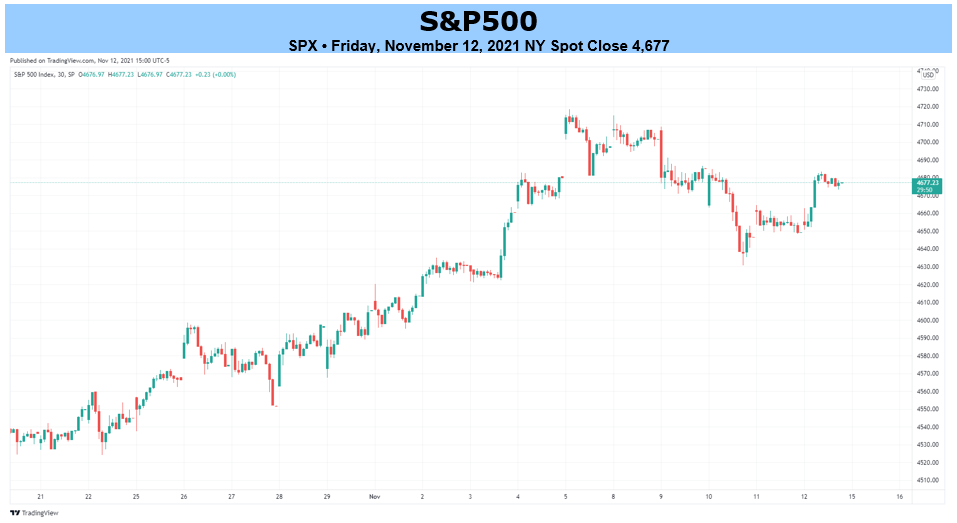
On Wall Street, futures tracking the Dow Jones, S&P 500 and Nasdaq 100 wrapped up this past week with a loss, falling about 0.6%, 0.3% and 1% respectively. While this ended a 5-week winning streak, these declines were hardly noticeable in comparison to the broader bull trend since the 2020 pandemic bottom. What is driving this and will it continue?
The slight increase in volatility this past week could have been traced to the latest US inflation report. In October, consumer prices climbed a whopping 6.2% y/y, leaving inflation running at its hottest pace since the early 1990s. This trend also transpired into deteriorating consumer confidence. On Friday, University of Michigan (UofM) sentiment data fell to a new post-pandemic low of 66.8. This was last seen 10 years ago.
The details of the report showed that consumers see inflation rising about 5% in the next year, the most since 2008. This is being driven by surging food, gas and housing prices. The CPI report showed that real wages are still negative. This means that inflation continues to erode their purchasing power. Yet, equities continued to hold onto their momentum, recovering cautiously on the UofM data.

University of Michigan Sentiment – Monthly Chart
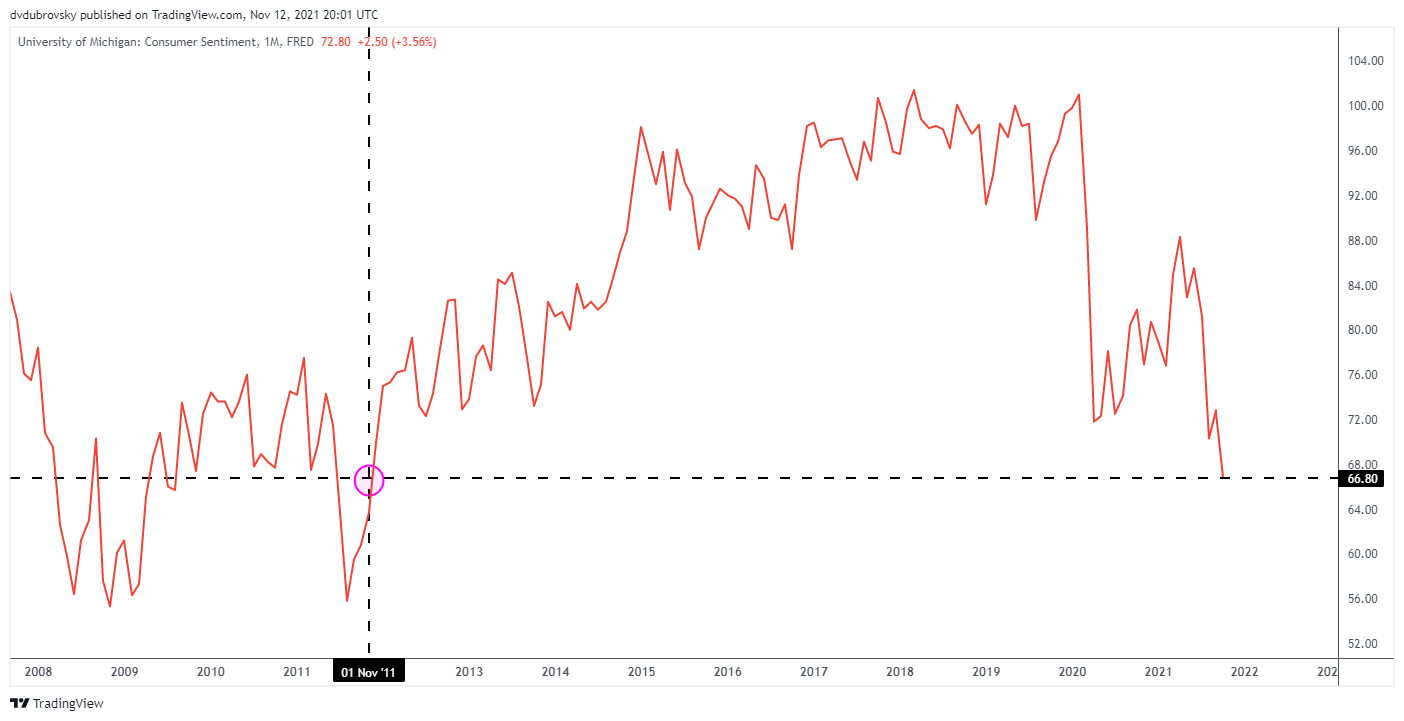
Chart Created in TradingView
The risk for equities is that higher inflation results in a hawkish shift at the Federal Reserve. On the whole, policymakers continue to gauge that recent price trends are transitory. Last week’s inflation print brought back market expectations for 2 Fed rate hikes by the end of next year. It will likely take more persistent elevated price readings to meaningfully shift that outlook.
Still, there will be a slew of Fedspeak in the week ahead. Commentary from Vice Chair Richard Clarida, New York branch President John Williams, Chicago branch President Charles Evans and more will cross the wires. All eyes will be on their views on inflation, especially following the latest CPI report. Check out the DailyFX Economic Calendar for more information about their speeches.
At the end of the day, investors seeking returns, especially amid rising inflation, won’t be able to get much from the local Treasury market. The Fed is only beginning quantitative easing tapering this month. Stocks can be an inflationary hedge, but rising prices mean traders will need increasingly higher returns compared to lower inflationary periods to makeup for the deteriorating purchasing power of the USD.
Historically speaking, stocks tend to be more volatile in higher inflationary periods. Value shares also tend to perform better compared to growth-oriented ones. It also depends on the economic situation. The current ratio of job openings compared to those unemployed is at a record, according to Bloomberg. Unemployment is still on the decline. US retail sales growth is expected to cross the wires at the highest since March next week following rosy third-quarter earnings. Healthy underlying fundamentals may keep equities afloat.
| Change in | Longs | Shorts | OI |
| Daily | -18% | 18% | 7% |
| Weekly | -19% | 14% | 4% |
S&P 500 Futures Vs. 2022 Fed Rate Bets – Daily Chart
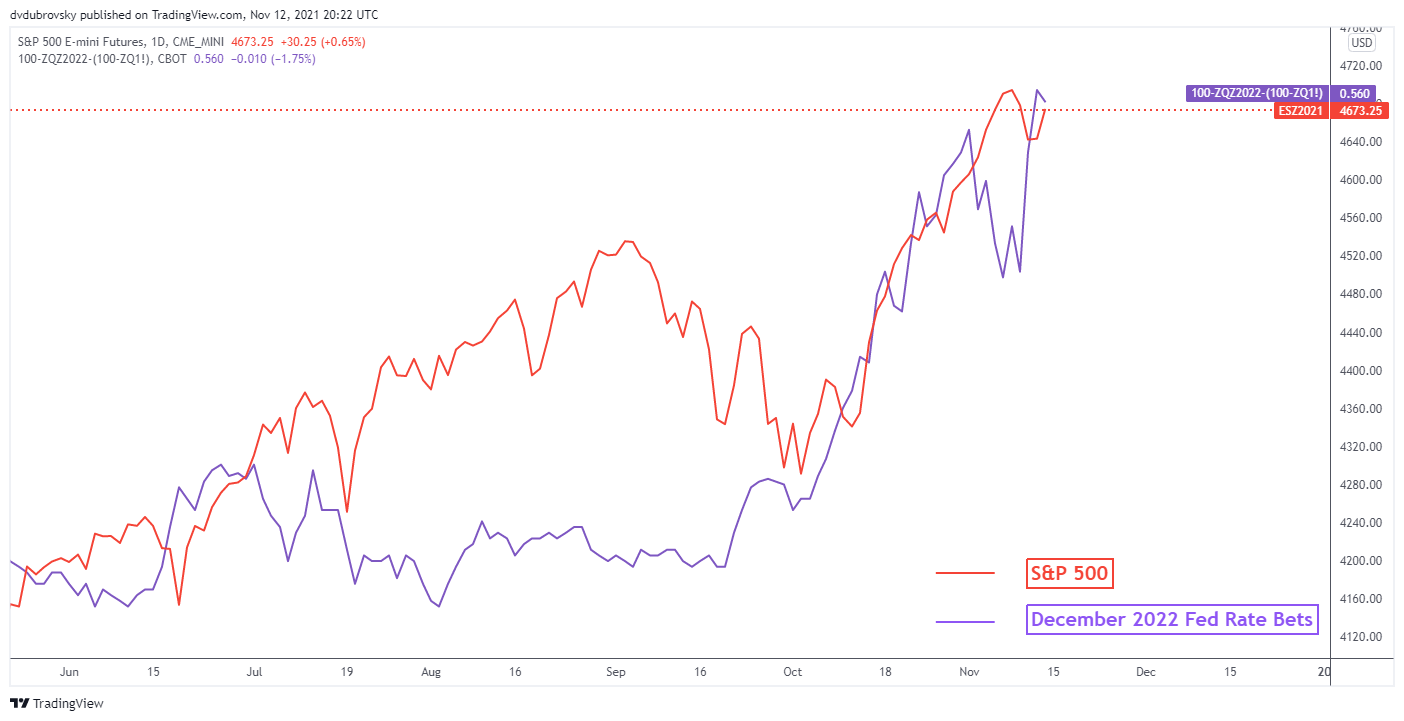
Chart Created in TradingView
--- Written by Daniel Dubrovsky, Strategist for DailyFX.com
To contact Daniel, use the comments section below or @ddubrovskyFX on Twitter


