


Courtesy of TradingView
Stocks Fundamental Forecast: Bullish
- Dow Jones, S&P 500 push higher as Nasdaq 100 consolidates
- Cyclically-oriented stocks following the climb in Treasury yields
- Key event risks: Jerome Powell, FOMC Minutes, US retail sales

Cyclical Shares to Continue Shining with Tech at Risk?
Last week, the Dow Jones Industrial Average managed to extend gains into new all-time highs after having spent the better part of the past three months trading sideways. The S&P 500 also climbed into record territory. It was the tech sector that fell relatively behind, with the Nasdaq 100 trading mostly flat. Could this be a meaningful turning point for the cyclical sector, which tends to closely follow the swings of the economy?
On the chart below, a ratio of the Nasdaq 100 to the Dow Jones can be seen inversely tracking the US 10-year Treasury yield. The latter is often viewed as a gauge of Fed monetary policy expectations and overall economic growth bets. As the Dow Jones consolidated, the 10-year yield trended lower, reversing much of the upside progress from the first quarter.
Dimming global growth prospects may have been fueling this trend, especially amid rising Covid-19 cases caused by the more contagious Delta variant. A deluge of “Fed-speak” this past week seemed to show that the central bank is still confident in the recovery. Speeches from presidents of the Richmond, Atlanta, Kansas and San Francisco Fed branches alluded to tapering quantitative easing this year.
Nasdaq 100 – Dow Jones Futures Ratio Versus 10-Year Treasury Yield
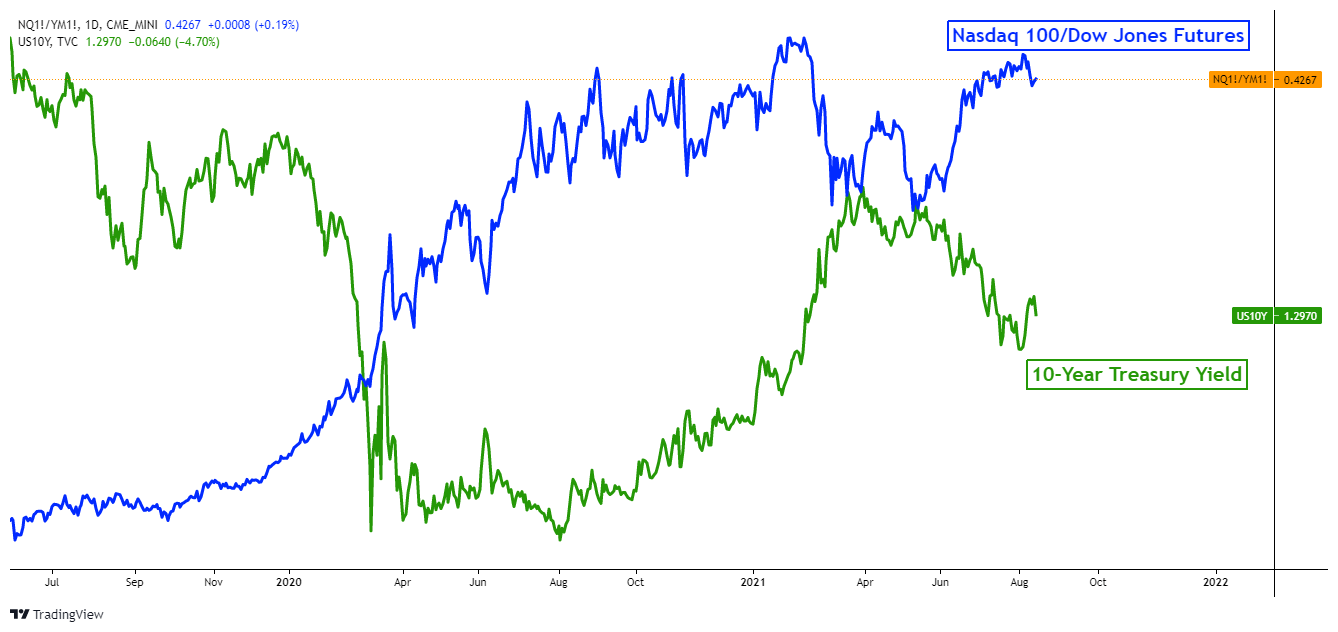
Chart Created in TradingView
Event Risk in the Week Ahead: Fed Chair Jerome Powell, FOMC Minutes, US Retail Sales
This is as US consumer inflation expectations touched an 8-year high while July’s CPI report seemed to reinforce the transitory inflationary narrative. Fed Chair Jerome Powell is slated to speak on Tuesday, where he could reiterate his more cautious approach on the economy. Dallas Fed President Robert Kaplan will also be speaking during the week, discussing local and global economic issues.
The most important economic event risk for Wall Street is likely to be the FOMC Minutes release on Wednesday. The markets cheered the outcome of July’s policy announcement as it seemed that tapering was not around the corner just yet. Since then, a solid non-farm payrolls report and Fed-speak about reducing quantitative easing seem to have been causing some repricing.
| Change in | Longs | Shorts | OI |
| Daily | -18% | 18% | 7% |
| Weekly | -19% | 14% | 4% |
The FOMC Minutes document could continue reinforcing the central bank’s broad confidence in the medium-term economic outlook. That may be more fuel for the Dow Jones to outperform the Nasdaq 100, with QE still going strong at $120 billion per month. Still, with US economic data tending to underperform relative to economists’ expectations lately, a softer retail sales report risks derailing this narrative.
Overall, the fundamental forecast for equities is bullish. On the chart below is a comparison of overnight Fed reverse repo volumes and the Chicago Fed Adjusted National Financial Conditions Index. The record surge in the former represents the central bank draining excess liquidity, suggesting that markets may be ready for tapering. This is as the latter continues to show easy credit conditions in the economy.
Check out the DailyFX Economic Calendar for more key events!
Fed RRR Volumes Versus Financial Conditions

Chart Created in TradingView
--- Written by Daniel Dubrovsky, Strategist for DailyFX.com
To contact Daniel, use the comments section below or @ddubrovskyFX on Twitter


