


S&P 500, FTSE 100 Analysis and News
- S&P 500 | Bond Yield Plunge Prompts Growth Outperformance
- FTSE 100 |Consolidation Phase Unlikely to Break

S&P 500 | Bond Yield Plunge Prompts Growth Outperformance
The past week has prompted a rethink among market participants over the global recovery, in which economic activity looks to be peaking, at a time where central banks are beginning to embark policy normalisation. However, while sizeable moves had been seen in the bond market, equities have been largely unscathed as the S&P 500 closes out the week at a fresh record high. Gains in the broader index stemmed from growth stocks (benefits from lower yields) amid the plunge in bond yields, and now is once again outperforming value stocks for the first time since February.
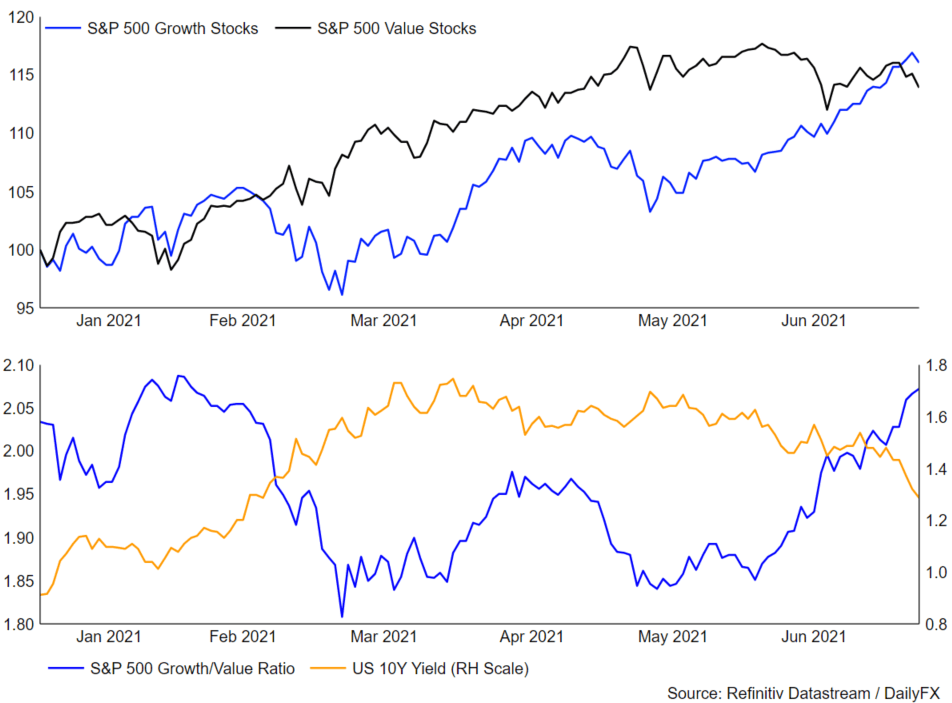
Looking ahead to next week, US CPI will be in focus with the headline expected to have dipped to 4.9% from 5%. Recent survey based measures (ISM Non Manufacturing PMI Prices Paid) on inflation have started to show signs of a peak and thus reinforcing the view that central bank’s may well be correct in their assessment that inflation is transitory. Should the headline CPI surprise on the downside, bond yields can be expected to renew its pullback, underpinning growth stocks.
Elswhere, Fed watchers will be on the look out for Fed Chair Powell’s semi-annual testimong with attention placed on any signs as to when the Fed could begin tapering asset purchases. However, in light of the plethora of Fed speak since the June meeting, it is likely that Powell will largely stick to the script in the view that the labour market has yet to reach substantial further progress.
| Change in | Longs | Shorts | OI |
| Daily | 1% | -1% | 0% |
| Weekly | 15% | -13% | -1% |
S&P 500 Price Chart: Daily Time Frame
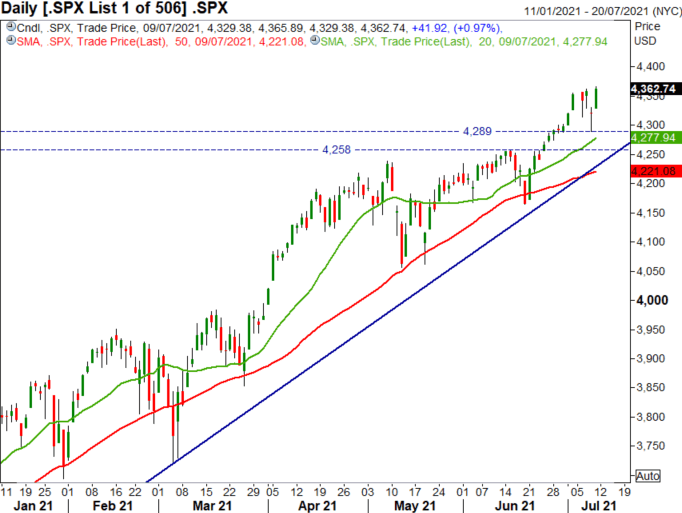
Source: Refinitiv
FTSE 100 | Consolidation Phase Unlikely to Break
The FTSE continues to hold a 7000-7200 range and while the index is in a consolidation phase, the overall trend remains higher. The recent easing of lockdown measures will be likely reflected in the latest UK inflation figures and thus risks are tilted to the upside. Similarly, inflationary pressures will be observed in the upcoming employment report, although, as the BoE have stressed, the labour market will come into greater scrunity once employment support programs expire in September. That said, direction in the FTSE 100 will stem from broader risk trends as opposed to domestic data.
FTSE 100 Price Chart: Weekly Time Frame

Source: Refinitiv
| Change in | Longs | Shorts | OI |
| Daily | -30% | 25% | 2% |
| Weekly | -44% | 44% | 0% |
RESOURCES FOR TRADERS
Whether you are a new or experienced trader, we have several resources available to help you; indicator for tracking trader sentiment, quarterly trading forecasts, analytical and educational webinars held daily, trading guides to help you improve trading performance, and one specifically for those who are new to forex.
--- Written by Justin McQueen, Market Analyst
Follow Justin on Twitter @JMcQueenFX


