


S&P 500 FUNDAMENTALFORECAST: BULLISH
- A ‘Blue Wave’ outcome propelled hopes for more aggressive fiscal and infrastructure spending
- Weaker private jobs report painted a souring picture in the services sector
- The S&P 500 index is trading at 30.3 price-to-earnings (P/E) ratio, far above its 5-year average

The exuberant rally in the S&P 500 index looks set to carry on as investors buy equity and other risk assets on reflation hopes – expectations that the Biden administration will be empowered to push forward fiscal and infrastructure spending after Democrats won two critical seats in Georgia’s Senate runoffs last week. In the meanwhile, base metal and crude oil prices surged to multi-month highs, reflecting a rising demand outlook as a cyclical recovery appears to be underway with the gradual rollout of Covid-19 vaccines.
Reflation refers to fiscal or monetary support that is introduced during economic downturns to spur growth and boost inflation, which usually occurs after an economic downturn. With the political chaos in Washington seems to be finally drawing to an end, investors appeared to have herded into stock markets chasing yield and growth.
Cyclical-linked energy, materials, financials and industrial sectors have been outperforming since the end of last year, extending a rotation into value from big tech names. The reflation trade may encourage a catch-up rally in the Dow Jones and S&P 500 index, both of which have largely underperformed relative to the Nasdaq 100 during 2020 as the pandemic hit traditional industries harder.
| Index | Last Price | % Return in 2020 | P/E Ratio |
|---|---|---|---|
| NASDAQ 100 STOCK INDX | 2,939 | 47.0 | 39.8 |
| S&P 500 INDEX | 3,803 | 15.6 | 30.3 |
| DOW JONES INDUS. AVG | 31,041 | 6.5 | 25.9 |
Source: Bloomberg
Yet, are market participants too optimistic about the economic outlook and pricing in a rosy picture of recovery too early? We are seeing a strange picture that is unprecedented – stock markets hit record highs when the global economy is suffering from a severe Covid-19 crisis that may last longer than people may have expected. A new strain of the virus and increasing lockdown measures may slow the pace of economic reopening, especially in smaller economies that lack the domestic market depth to cushion against external headwinds. The effectiveness of Covid-19 vaccines remains to be proven in the public, and an uneven rollout in different countries may undermine a global effort to contain the spread of the virus.
More worryingly, job market sentiment is weakening against the backdrop of pandemic waves and social distancing measures. In December, the US private payrolls report registered its first negative print in six months, with 123k job lost (chart below). It marked a sharp contrast to the baseline forecast calling for an 88k increase. The job losses were heavily concentrated in the leisure and hospitality industry, which pointed to the severity of pandemic’s impact on the service sector.
US ADP Employment Change
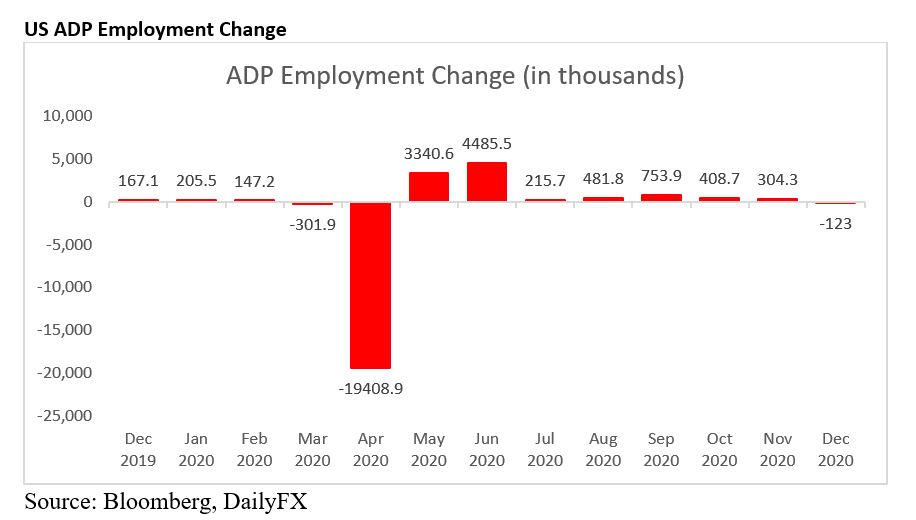
Source: Bloomberg, DailyFX

Valuation-wise, the S&P 500 index is trading at a 30.3 price-to-earnings (P/E) ratio, which is the highest level seen in two decades and is nearly 50% above its five-year average of 20.5. Rich valuation may render the index vulnerable to profit taking, especially in a market that has nearly priced in all the available positive news and even future growth.
S&P 500 Index vs. P/E Ratio – 5 Years
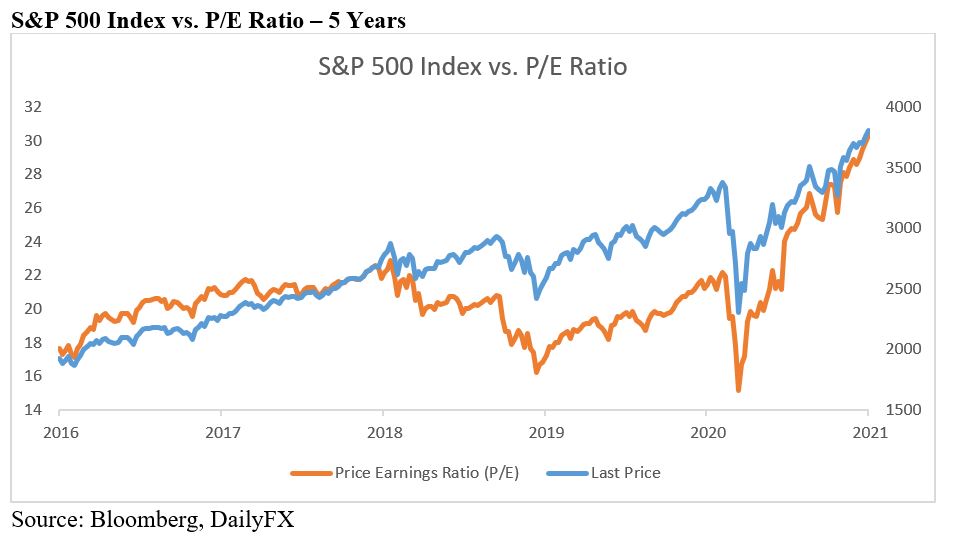
Source: Bloomberg, DailyFX

--- Written by Margaret Yang, Strategist for DailyFX.com
To contact Margaret, use the Comments section below or @margaretyjy on Twitter


