


Source: IG Charts
S&P 500, FTSE 100 Analysis and News
- S&P 500 | Nearing Record High
- FTSE 100 |Negative Rates Lower Down the Pecking Order of Stimulus Measures
Source: DailyFX, Refinitiv
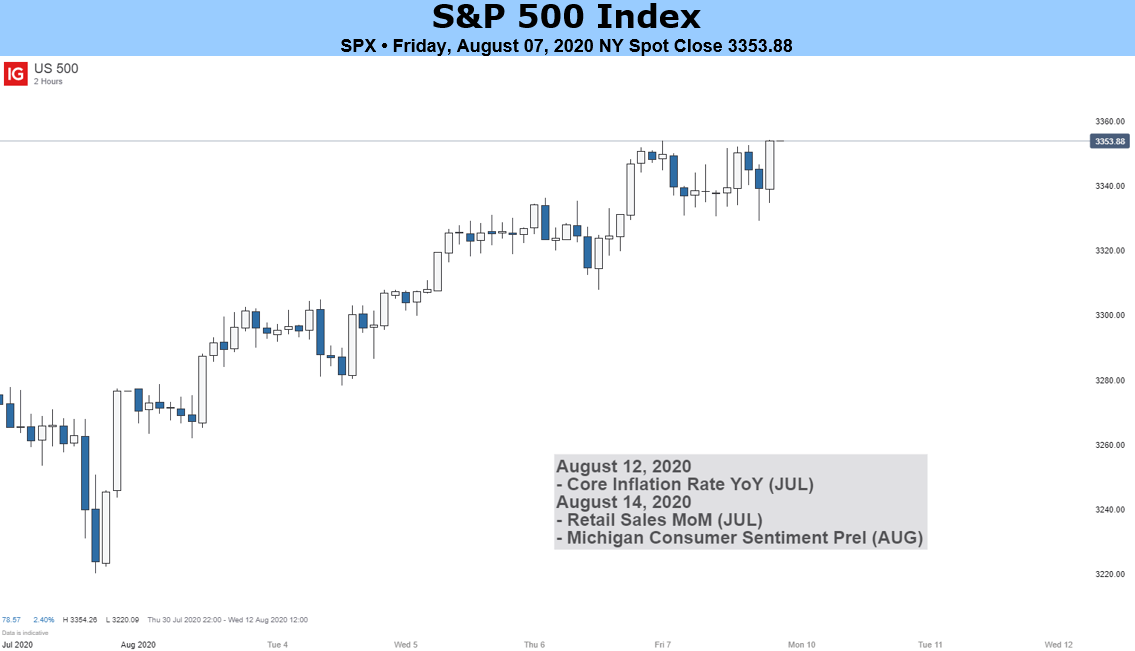
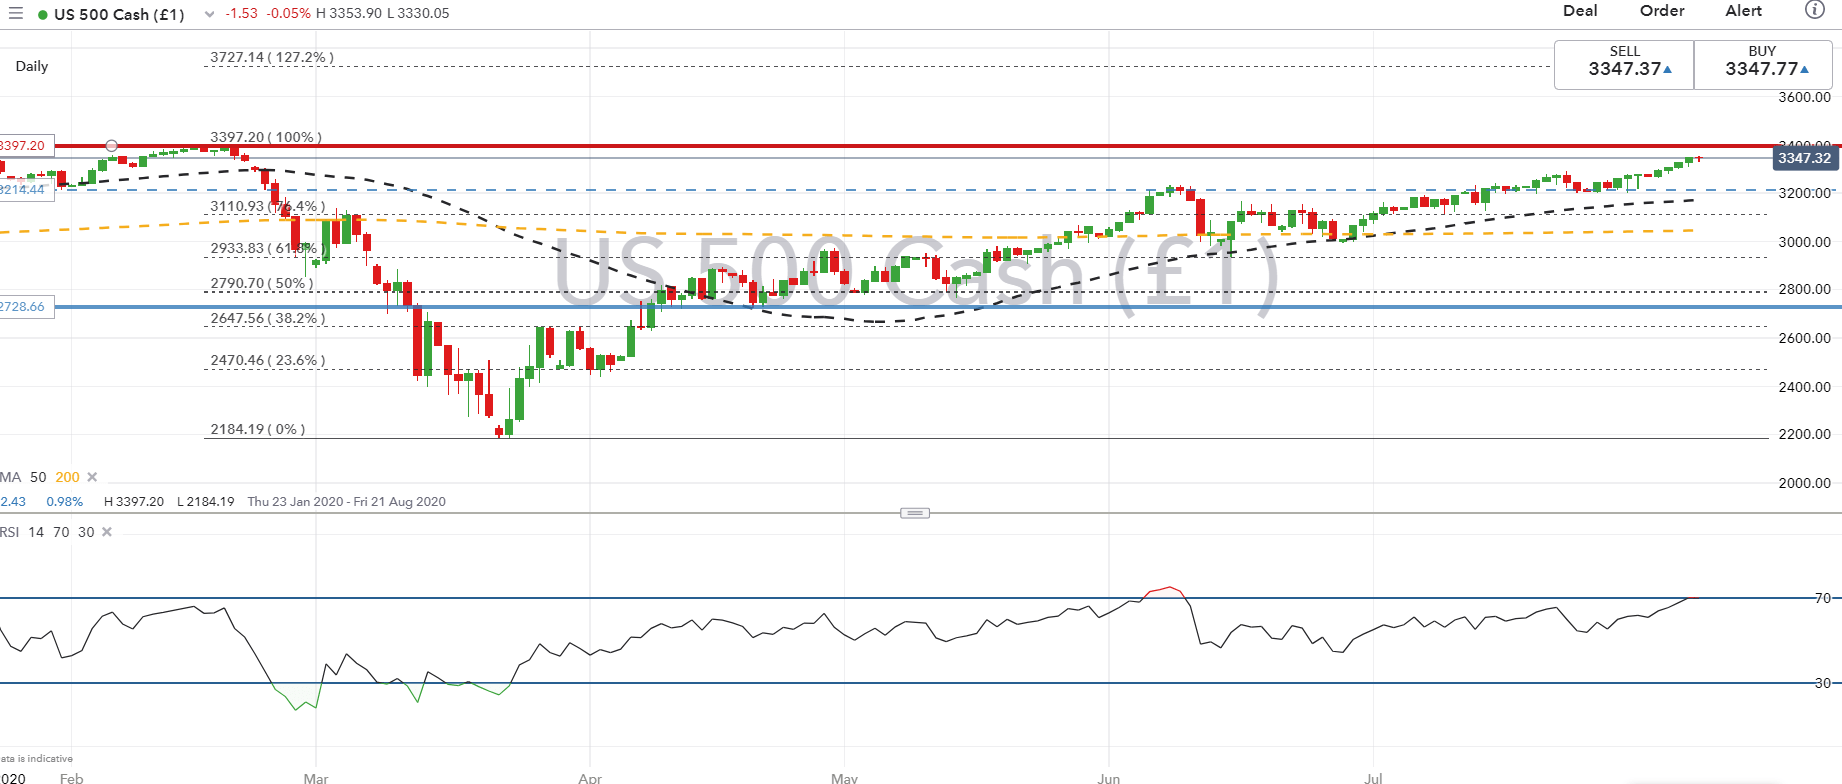
S&P 500 | Nearing Record High
Another stellar week for US equities with tech stocks once again leading the charge. Friday’s NFP report provides further encouragement that the recovery remains intact. That said, perhaps what will be key to providing a further lift to equity markets will be next week’s retail sales data. As it stands, higher frequency data has thus far shown a slowdown in consumption amid renewed restrictions in several US states. We await next week’s retail sales for confirmation.
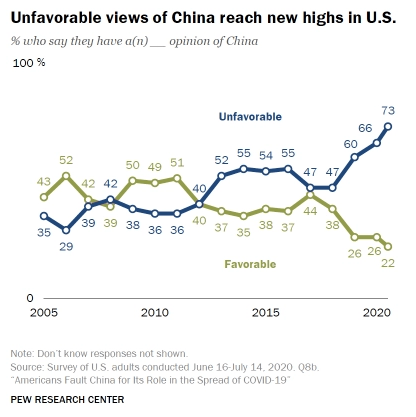
Elsewhere, US-China tensions continue to pick-up, this time with the US looking to impose sanctions on Hong Kong Chief Carrie Lam. This backdrop comes ahead of the US reviewing the current trade deal on August 15th as to whether China has adhered to the pact. Therefore we place a close on US rhetoric towards China ahead of the compliance review, while there is also a risk of a retaliation from Beijing in regard to the recent sanctions.
Trump Support Benefits from Anti-China Rhetoric
| Change in | Longs | Shorts | OI |
| Daily | 1% | -1% | 0% |
| Weekly | 15% | -13% | -1% |
S&P 500 Price Chart: Daily Time Frame
Source: IG Charts
FTSE 100 |Negative Rates Lower Down the Pecking Order of Stimulus Measures
The Bank of England kicked back expectations of negative rates in the UK with the central bank stating that other tools are at its disposal, suggesting that the NIRP is lower down the pecking order of stimulus measures. That said, the FTSE 100 appears to be settling in a lower range with the index failing to make strides above 6100. Short-term support is situated at 5850 with a move below opening up 5600. Next week will see the release of the UK Q2 GDP report, however, given that this data comes with a lag we expect this to have a minimal impact on UK assets.
| Change in | Longs | Shorts | OI |
| Daily | -30% | 25% | 2% |
| Weekly | -44% | 44% | 0% |
FTSE 100 Price Chart: Daily Time Frame

Source: IG Charts
RESOURCES FOR TRADERS
Whether you are a new or experienced trader, we have several resources available to help you; indicator for tracking trader sentiment, quarterly trading forecasts, analytical and educational webinars held daily, trading guides to help you improve trading performance, and one specifically for those who are new to forex.
--- Written by Justin McQueen, Market Analyst
Follow Justin on Twitter @JMcQueenFX


