


Equity Analysis and News
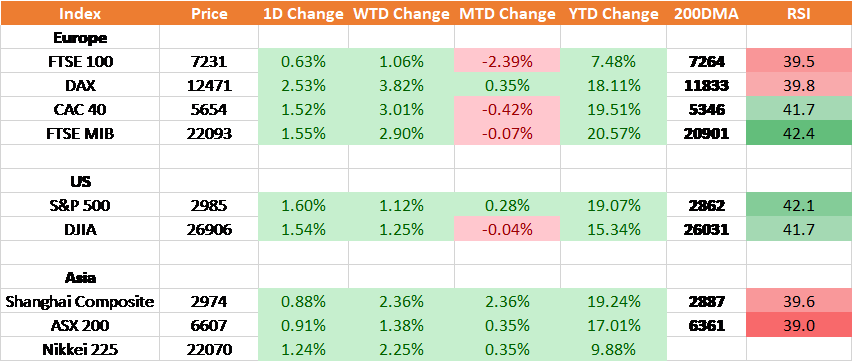
- FTSE 100 | Domestic Stocks (FTSE 250) Outperform International stocks (FTSE 100)
- S&P 500 | US-China Interim Deal Needed for Next Leg Higher
Source: Thomson Reuters, DailyFX
Politics remains the key driver for risk assets. Rising optimism pertaining to US-China trade talks and Brexit negotiations have lifted equity markets to close the week on a high note. However, while optimism have buoyed risk sentiment, we ask ourselves the critical question of “deal or no deal?”.
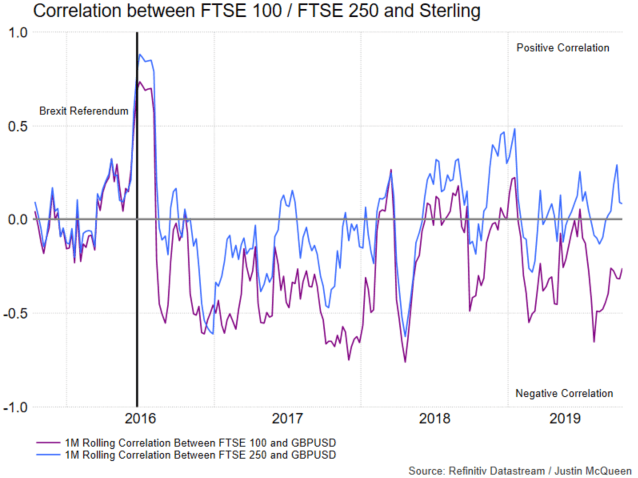
FTSE 100 | Domestic Stocks (FTSE 250) Outperform International stocks (FTSE 100)
The Pound is set to record its largest 2-day advance in over a decade as both the UK and Ireland highlighted that there is a “pathway to a deal”, while EU Chief Negotiator Barnier had been given the greenlight for tunnel negotiations. Consequently, this has seen domestics stocks (FTSE 250) outperform international stocks (FTSE 100). However, going forward, the response from DUP will be key, given that this will be crucial for the likelihood of a deal getting through parliament.
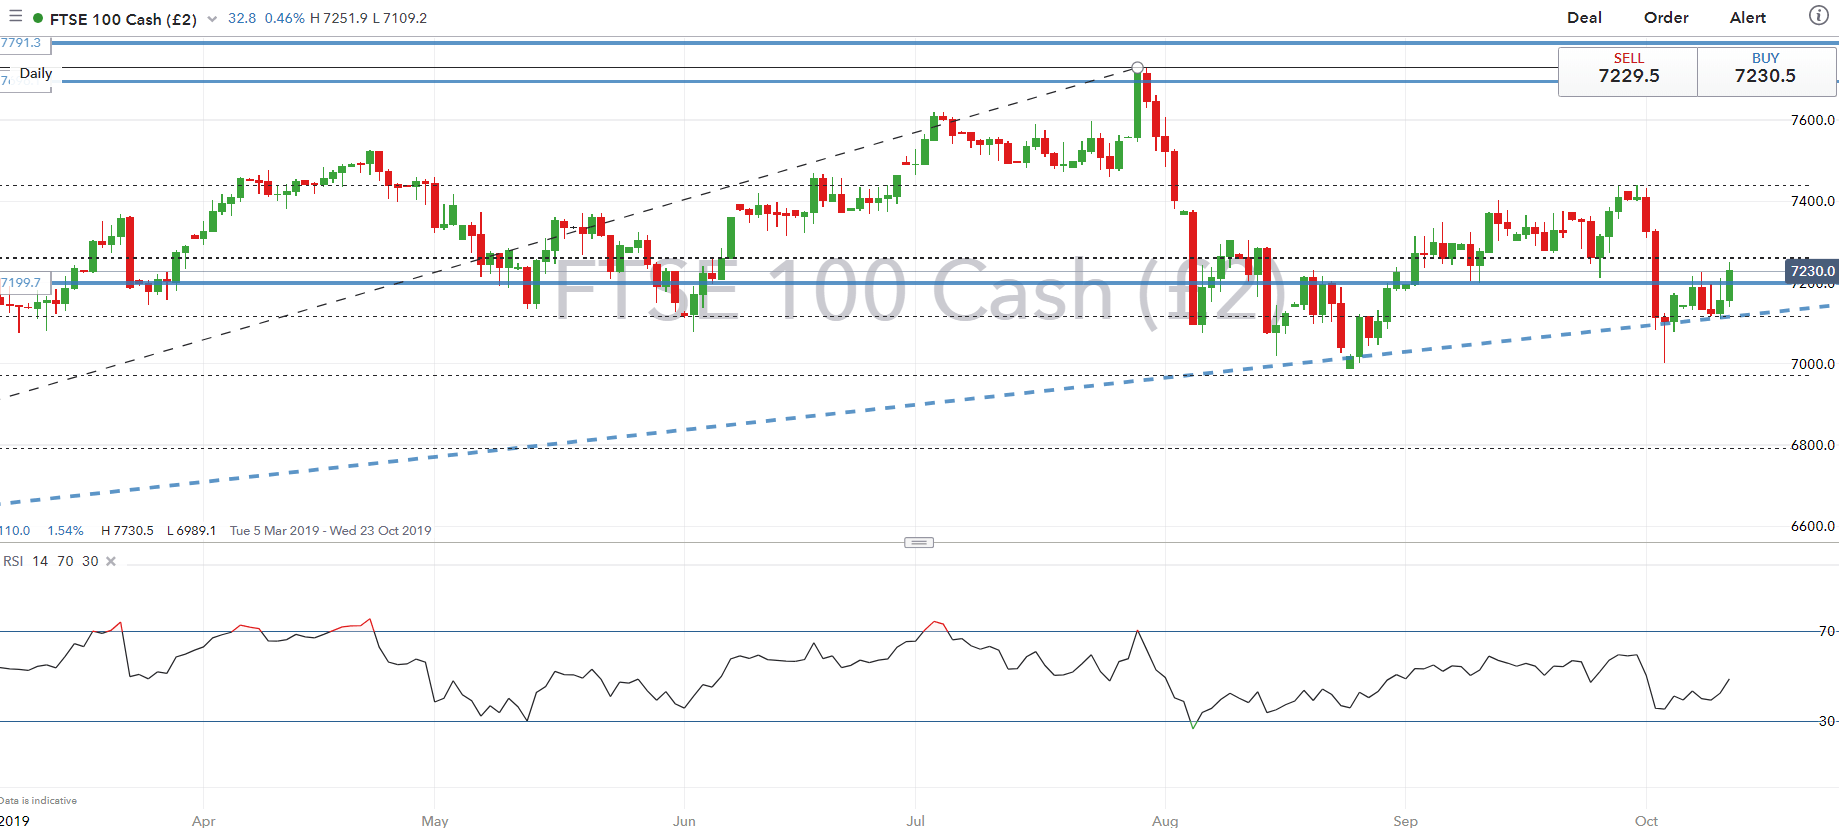
FTSE 100 Price Chart: Daily Time Frame (May 2019 – Sep 2019)
S&P 500 | US-China Interim Deal Needed for Next Leg Higher
In the event-driven backdrop, the S&P 500 has recovered from its recent drop as markets investors grow increasingly optimistic over a potential interim trade agreement between the US and China. If indeed an agreement is found, the S&P 500 would likely see a topside breach of the 3000 level with further buying in the index extending throughout the week.
S&P 500 Chart: Daily Time Frame (Feb 2019 – Sep 2019)

RESOURCES FOR FOREX & CFD TRADERS
Whether you are a new or experienced trader, we have several resources available to help you; indicator for tracking trader sentiment, quarterly trading forecasts, analytical and educational webinars held daily, trading guides to help you improve trading performance, and one specifically for those who are new to forex.
--- Written by Justin McQueen, Market Analyst
To contact Justin, email him at Justin.mcqueen@ig.com
Follow Justin on Twitter @JMcQueenFX


