


Oil Forecast: Neutral
- Crude oil prices remain supported as fundamentals and technical support higher prices
- US Crude (WTI) tests the upper bound of the rising channel formation
- Brent crude rebounds from $86

Over the past few weeks, oil prices have continued to proceed along a upward trajectory as commodity shortages remain a key concern for global economies.
With OPEC+ expected to meet on November 4th, output cuts will likely continue to support oil’s steady rise unless the organization agrees to increase production by a larger amount.
Meanwhile, key technical levels may further assist in the catalyzation of price action for the imminent move.
Oil – US Crude (WTI) Price Action
After nine consecutive weeks of gains, WTI crude oil is currently testing a key level of resistance at the key psychological level of $84.
After pricing in the fundamental factors which remain at the forefront of risk sentiment, oil prices may likely continue to sustain the upward trajectory, at least for now.

If bulls are able to push through the key level of resistance at $85, a breakout towards $90.00 may be in the cards. However, fears of higher wage inflation and increased production could result in a resumption of the bear trend and a possible retest of psychological support at $80.00.
US Crude Oil (WTI) Weekly Chart
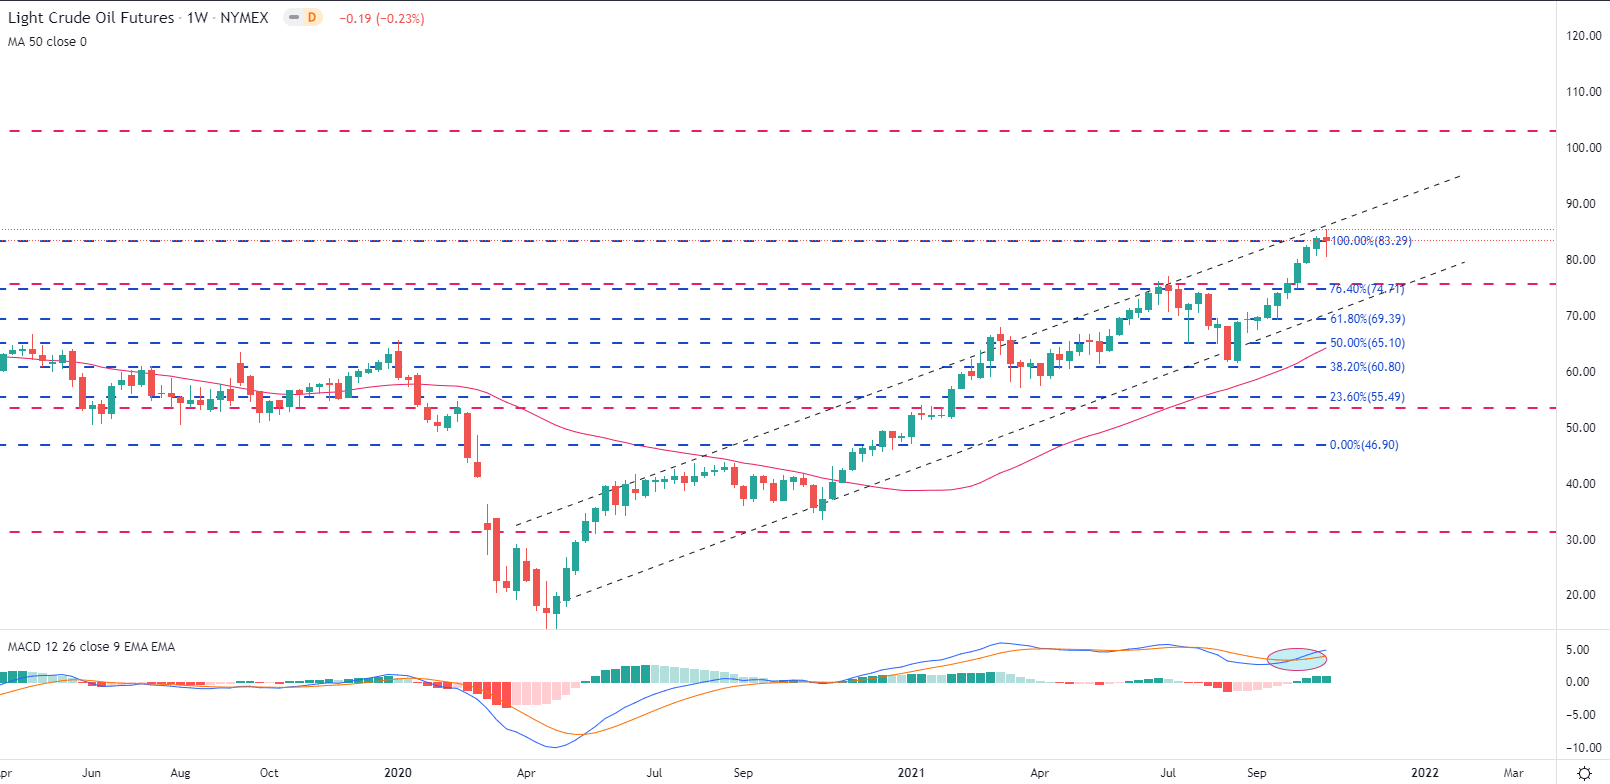
Chart prepared by Tammy Da Costa using TradingView
How to Trade Oil: Crude Oil Trading Strategies & Tips
Meanwhile, the weekly chart above illustrates how Fibonacci levels from historical moves have provided additional support and resistance for oil prices over a longer period of time.
Introduction to Technical Analysis
Fibonacci
Learn more about Fibonacci with DailyFX Education
While key Fibonacci levels will likely continue to provide both support and resistance for future prices, a MACD crossover above the zero line suggests that the upward momentum may be losing steam.
US Crude Oil (WTI) Daily Chart
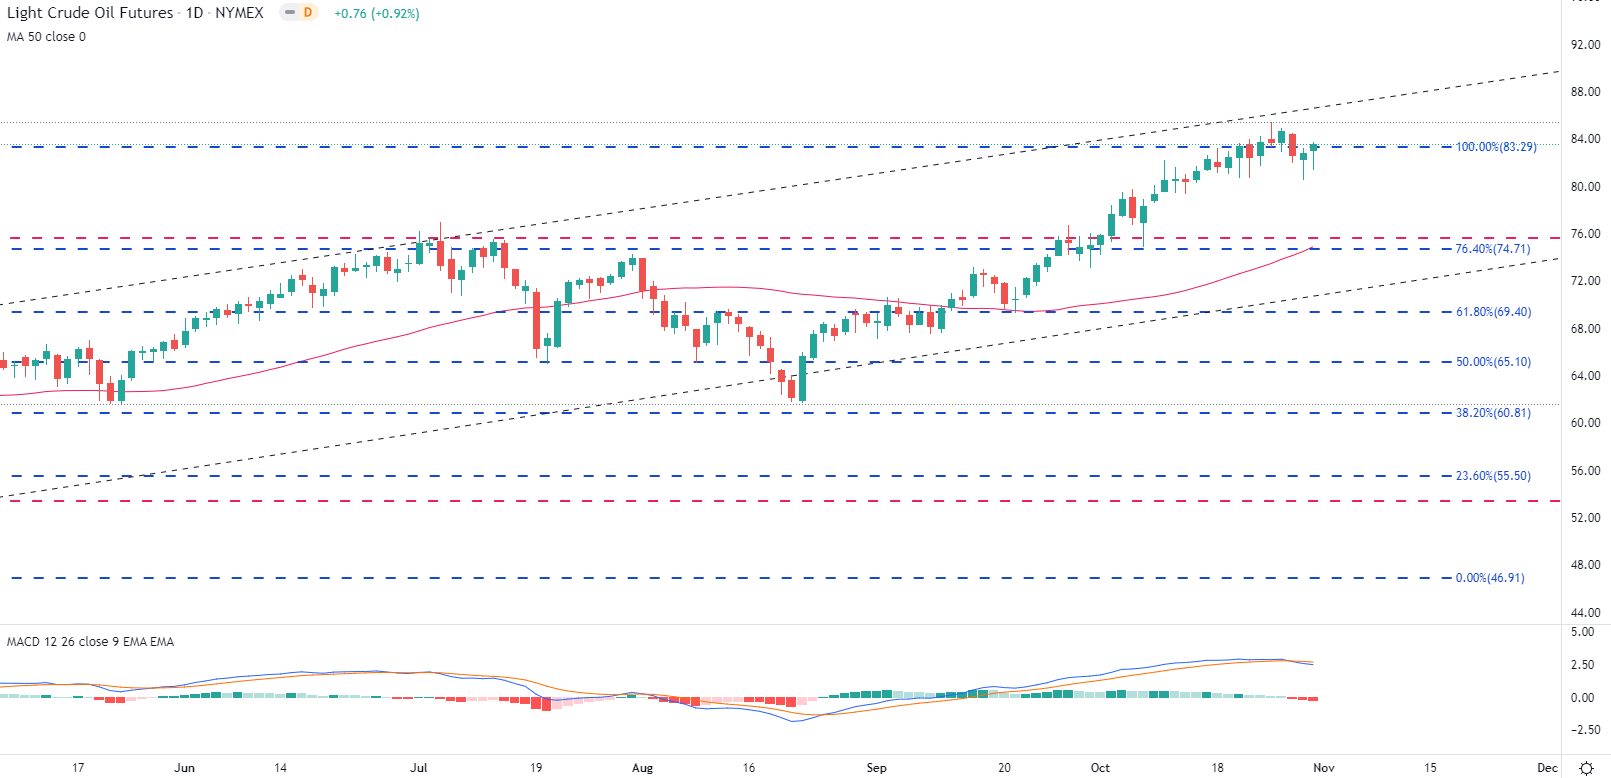
Chart prepared by Tammy Da Costa using TradingView
| Change in | Longs | Shorts | OI |
| Daily | 3% | -7% | 1% |
| Weekly | 31% | -38% | 7% |
--- Written by Tammy Da Costa, Analyst for DailyFX.com
Contact and follow Tammy on Twitter: @Tams707


