


GOLD TALKING POINTS
Gold prices are trading back below the $1300 handle as fresh developments coming out of the U.S. economy boost bets for higher interest rates, and market participants may continue to shun the precious metal as the Federal Reserve appears to be on course to normalize monetary policy throughout the second-half of the year.
Fundamental Forecast for Gold: Bearish
With limited U.S. data prints on tap for the week ahead, gold prices may face range-bound conditions especially as the Federal Open Market Committee (FOMC) enters its quiet period ahead of the June 13 interest rate decision, but the material shift in market behavior may continue to take shape over the near-term as the central bank is widely expected to deliver a 25bp rate-hike later this month.
As a result, gold prices remain vulnerable ahead of the quarterly meeting as Chairman Jerome Powell & Co. plan to phase out the forward-guidance for monetary policy, and the updated projections from Fed officials may produce fresh headwinds for bullion if the central bank shows a greater willingness to extend the hiking cycle.
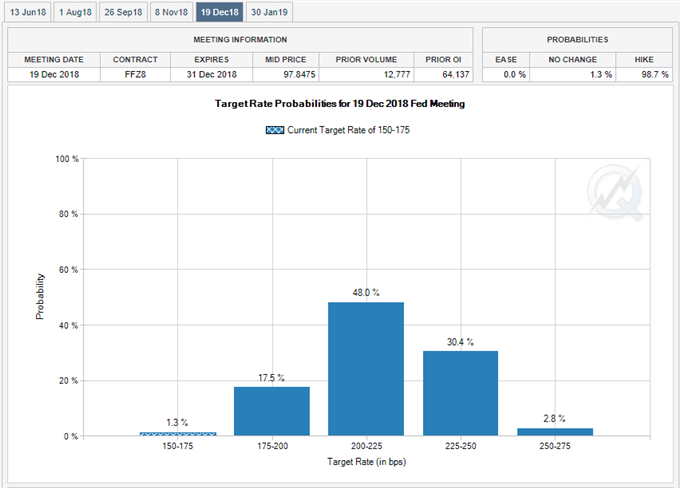
Keep in mind, Fed Fund Futures continue to reflect limited expectations for four rate-hikes in 2018 as the FOMC looks to tolerate above-target inflation for the foreseeable future, but near-term price action keeps the broader outlook tilted to the downside as both price and the Relative Strength Index (RSI) extend the downward trends from earlier this year,
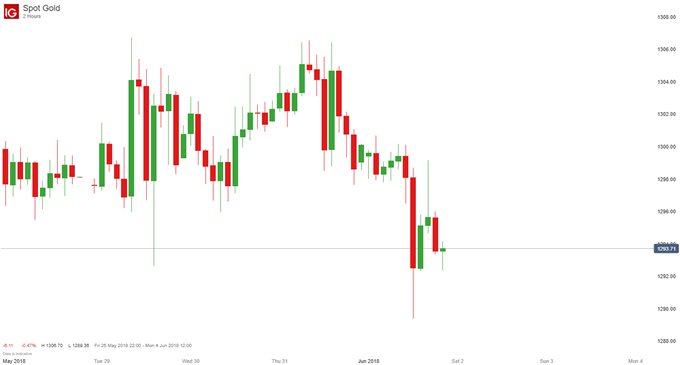
Gold Daily Chart

Bullion may continue to carve a fresh string of lower highs & lows as it marks a failed attempt to push back the 200-Day ($1307) simple-moving average (SMA), and the rebound from the December-low ($1236) may continue to unravel as the bearish momentum from earlier this year appears to be reasserting itself. In turn, a break/close below $1288 (23.6% expansion) to $1291 (50% expansion) raises the risk for a move towards the $1271 (38.2% expansion) to $1279 (38.2% retracement) region, with the next area of interest coming in around $1260 (23.6% expansion).
For more in-depth analysis, check out the Q2 Forecast for Gold
Additional Trading Resources
Are you looking to improve your trading approach? Review the ‘Traits of a Successful Trader’ series on how to effectively use leverage along with other best practices that any trader can follow.
Want to know what other currency pairs the DailyFX team is watching? Download and review the Top Trading Opportunities for 2018.
Interested in having a broader discussion on current market themes? Sign up and join DailyFX Currency Analyst David Song LIVE for an opportunity to discuss potential trade setups!
--- Written by David Song, Currency Analyst
Follow me on Twitter at @DavidJSong.


