


USD/CAD Analysis
USD/CAD Fundamental Backdrop
USD/CAD had a rollercoaster week after the Bank of Canada (BoC) surprised markets by hiking rates by 100bps. The knock-on impact saw money markets price the Fed’s upcoming rate decision higher with 100bps call gaining traction. Higher than expected inflation, PPI and retail sales data augmented this outlook as we look ahead to Canadian inflation next week (see economic calendar below):
USD/CAD ECONOMIC CALENDAR
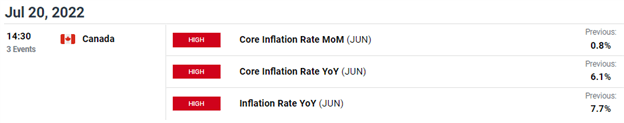
Source: DailyFX Economic Calendar

Depressed crude oil prices remain with the Chinese economy showing signs of slowing despite fundamental supply data under strain.
TECHNICAL ANALYSIS
USD/CAD DAILY CHART
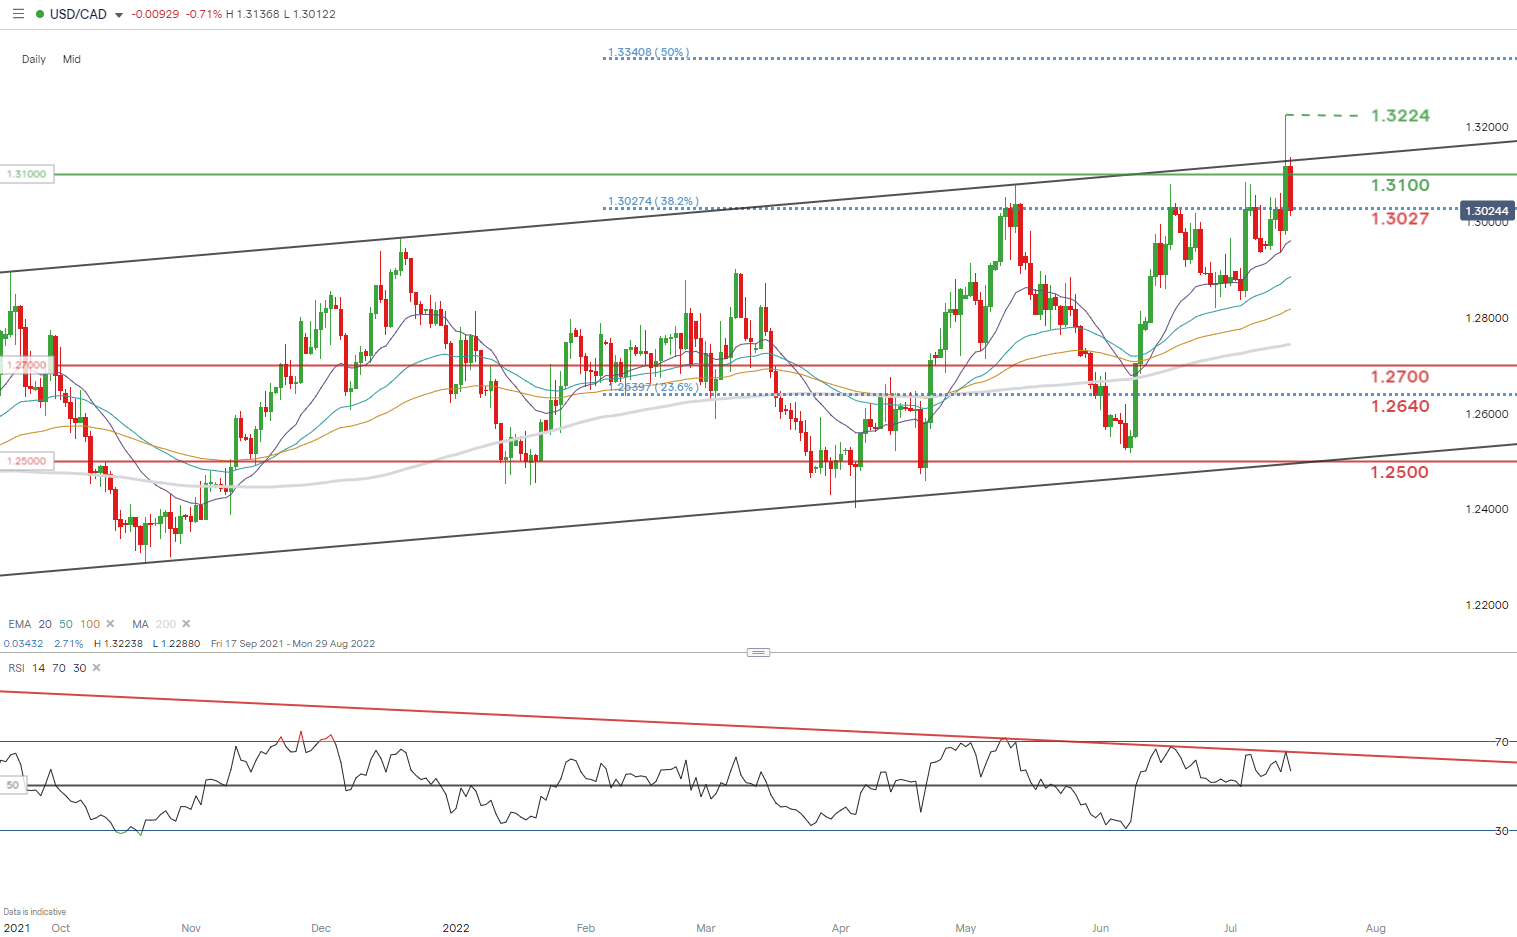
Chart prepared by Warren Venketas, IG

Price action on the daily USD/CAD chart is trading at a key inflection point (long-term channel resistance) making higher highs. On the contrary, the Relative Strength Index (RSI) reflects slowing upside momentum (red) thus suggestive of bearish divergence. Traditionally, bearish divergence points to impending downside but under the current fundamental backdrop it is difficult to see this happening short-term. A confirmation close/breakout above the ascending channel will invalidate this bearish indication particularly with markets expectant of a 100bps Fed rate hike.
Key resistance levels:
- 1.3224
- 1.3100
Key support levels:
- 1.0327 (382.% Fibonacci)
- 20-day EMA (purple)
IG CLIENT SENTIMENT DATA: MIXED
IGCS shows retail traders are currently prominently LONG on USD/CAD, with 62% of traders currently holding long positions (as of this writing). At DailyFX we typically take a contrarian view to crowd sentiment but after recent changes in longs and shorts, sentiment reveals a watchful bias.
| Change in | Longs | Shorts | OI |
| Daily | -2% | 7% | 5% |
| Weekly | -30% | 38% | 13% |
Contact and follow Warren on Twitter: @WVenketas


