


US Dollar, Crude Oil, AUD/USD, NOK, Gold, Russia, Ukraine, Powell, NFPs - Talking Points
- USD joined crude oil and other haven assets higher amid nuclear disaster threat
- APAC equities took a hit lower and remain vulnerable as risks to growth remain
- Commodities continue to roar higher.Will NFPs help USD to new heights?
Trade Smarter - Sign up for the DailyFX Newsletter
Receive timely and compelling market commentary from the DailyFX team
The US Dollar and crude oil surged again today after news of a Russian attack on a Ukraine nuclear power plant further stoked concerns of energy shortages. Initial reports sent markets into a spin with oil, gold, USD, JPY and CHF rallying while equities, the Euro, AUD and NZD sunk.
Clarification of the situation revealed that the strike did not hit essential equipment and that the fire could be contained. The International Atomic Energy Agency was reportedly informed that radiation levels had not changed. This saw somewhat of a reversal of the initial reaction.
The exception is the ongoing weakness in APAC shares relative to US futures. Japan’s Nikkei 225 and Hong Kong’s Hang Seng indices are notably deep in the red today.
Commodity currencies have also found support with AUD/USD pushing to new highs for the year. The Norwegian Krone is also well supported, which is hardly surprising given the wealth of energy resources they possess.
Inflation worries are gathering pace with Russia becoming more and more isolated by the day. Reports of shipping lanes shutting down has added to the perceived scarcity of energy, metal and agricultural supplies.
Market priced 2-year inflation remains above 4% in the US after hitting a high of 4.36% this week, the highest level on record. It is well above the Fed’s target of slightly above 2%. There is speculation that the Fed might raise this target level.
Federal Reserve Chair Jerome Powell again confirmed overnight that they are all set for a 25 basis-point hike in rates at their March meeting. Although he did note that it was “too early to say if Russia changes the rate path.”
With inflation expectations ticking up, real yields have gone south again. US 10-year real yields are down 50 basis points from the February highs. This benefits gold as an alternative haven investment and comes on top of the supply issues emanating out Russia, the world’s 3rd largest producer of the precious metal.
Looking ahead, the US non-farm payrolls (NFP) data will be watched closely. A Bloomberg survey has the market looking for 423k jobs to have been added in the month of February.

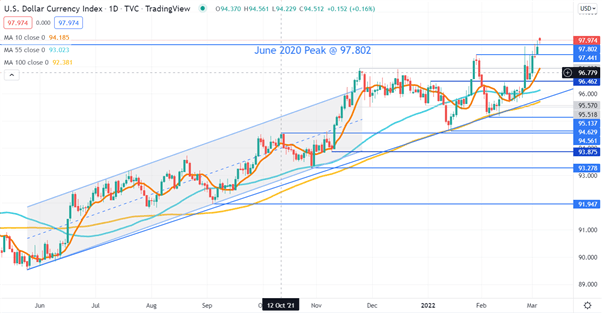
US DOLLAR (DXY INDEX) Technical Analysis
The US Dollar remains above ascending trend lines and above a series of simple moving averages (SMA). This may indicate unfolding bullish momentum. It has trade above the June 2020 high today.
A bullish triple moving average (TMA) formation requires the price to be above the short term SMA, the latter to be above the medium term SMA and the medium term SMA to be above the long term SMA. All SMAs also need to have a positive gradient.
Looking at the 10, 55 and 100-day SMAs, the criteria for a TMA have been met.
Immediate support could be at pivot points of 97.802 and 97.441.
--- Written by Daniel McCarthy, Strategist for DailyFX.com
To contact Daniel, use the comments section below or @DanMcCathyFX on Twitter


