


Japanese Yen, USD/JPY, Crude Oil, AUD/NZD, US Treasures, China - Talking Points
- USD/JPY is approaching a new high since the pandemic began
- APAC equities move higher as US debt ceiling woes subsided
- Crude oil resumes rally. Will USD/JPY break new ground?

The Japanese Yen was undermined by a return to risk assets and higher energy prices today. Concerns about the US debt ceiling appear to be shelved for now and this allowed most APAC equity markets to trade higher. The exception was mainland Chinese indices as they re-opened today after Golden Week holidays and played catch up to the rest of the world’s mid-week carnage.
China came back from the break to see a strong September Caixin PMI services number at 53.4, against a 49.2 forecast. Markets will be watching the PBOC for liquidity measures and any movement in the reserve requirement ratio (RRR).
With the US debt problem kicked down the road to December, markets returned to focusing on inflation and supply constraints in energy markets. US 10-year inflation ticked up toward 2.5%, as measured by break-even rates.
The long end of developed market curves all saw yields continue to elevate. US 10- year and 30-year Treasuries went to 1.596% and 2.156% respectively. Australian and New Zealand 10-year government rates moved up 5 basis points. AUD/NZD moved lower as short end rate differentials widened in the aftermath of the RBNZ rate hike earlier in the week, where the official cash rate went up by 25 basis points.
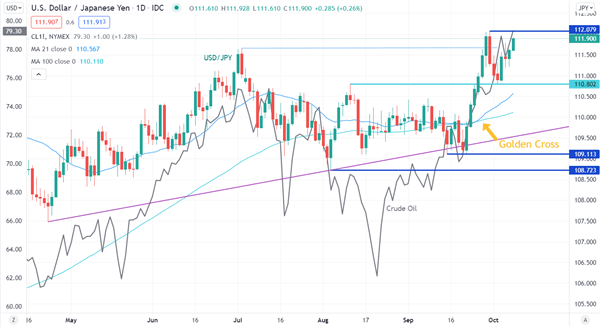
Brent crude oil approached US$ 80 a barrel as the reprieve from Russia’s offer of record oil and gas deliveries to Europe appeared to be over. This sent USD/JPY toward the recent yearly high at 112.097. See the chart in the Technical Analysis section below.
Recent reports that China has begun using Australian coal again could be negative for Japan. They import large quantities of Australian coal and might have another significant buyer to compete with.
Looking ahead, US non-farm payrolls will be the focus today. Canadian jobs numbers are also due out at the same time.
Introduction to Technical Analysis
Learn Technical Analysis
Recommended by Daniel McCarthy
USD/JPY Technical Analysis
USD/JPY tried lower on Monday but failed to move below the pivot point at 110.802. It has since rallied.
Previous to that, a bullish Golden Cross occurred when the 21-day simple moving average (SMA) crossed above the 100-day SMA near the beginning of the run higher.
Both SMAs have a positive gradient, and the longer term one is below the shorter term line. The SMAs are also below the price, which could see bullish momentum evolve.
The next potential resistance level could be at the most recent high of 112.097. On the downside, support may rest at the pivot points of 110.802 and 110.447, then possibly at the previous lows of 109.113 and 108.723.
--- Written by Daniel McCarthy, Strategist for DailyFX.com
To contact Daniel, use the comments section below or @DanMcCathyFX on Twitter


