


EUR/USD, EUR/JPY, Coronavirus Vaccine, European Lockdowns, Inflation – Talking Points:
- Equity markets broadly gained during APAC trade as the rollout of several Covid-19 vaccines fuelled global growth bets.
- The tightening of restrictions in several European nations may hamper the Euro’s climb against its haven-associated counterparts.
- However, better-than-expected inflation and PMI figures could bolster the currency against USD and JPY.
Asia-Pacific Recap
Equity markets broadly gained during Asia-Pacific trade as investors cheered the gradual rollout of several coronavirus vaccines and bet on a return to economic normality in 2021.
Australia’s ASX 200 index stormed 1.47% higher and Hong Kong’s Hang Seng index rose 0.7%, while China’s CSI 300 soared 1.25%. Japan’s Nikkei 225 failed to follow its regional counterparts higher, sliding 0.68% lower as Prime Minister Yoshide Suga stated he is considering declaring a state of emergency in Tokyo to stem a marked increase in Covid-19 infections.
In FX markets, the cyclically-sensitive Norwegian Krone largely outperformed alongside the Euro, as the haven-associated US Dollar continued to lose ground against its major counterparts. The second-most heavily traded cryptocurrency Ethereum extended its recent surge higher, climbing over 13% while Bitcoin hovered just shy of the $34,000 mark.
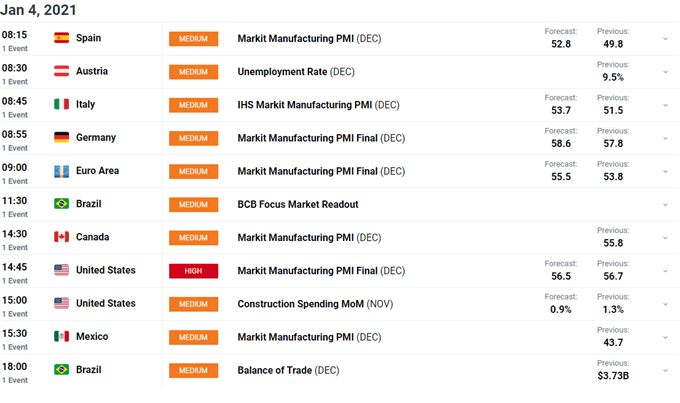
Gold and silver also benefited from the Greenback’s slide, gaining 1.3% and 2.83% respectively despite yields on US 10-year Treasuries pushing back above 0.94%. Looking ahead, a slew of PMI figures out of Europe and the US headline the economic docket alongside Brazil’s trade balance release for the month of December.
Tightening Restrictions Could Limit Euro’s Upside
The Euro stormed higher against its haven-associated counterparts in 2020, climbing 3.4% and 8.8% respectively against the Japanese Yen and US Dollar. These gains look set to continue into the first quarter of 2021, as bullish technical setups begin to take shape across multiple different timeframes.
However, rising infection rates and tightening coronavirus restrictions in several European nations may limit the currency’s upside potential in the near term. German Chancellor Angela Merkel and her government are considering extending the hard lockdown implemented in December, as the 7-day moving average tracking Covid-19 deaths surges above 670.
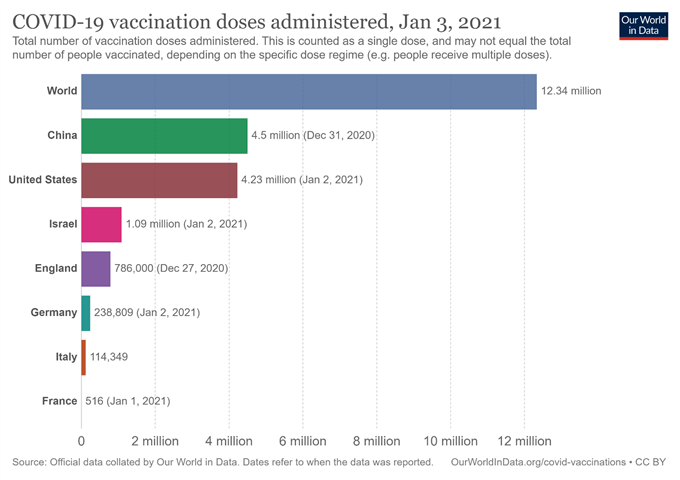
Moreover, the cumbersome rollout of the vaccine also threatens to hamper the region’s economic recovery, with strong anti-vaccine sentiment in France resulting in only 516 citizens – as of January 1 – receiving the shot. Indeed, health authorities across the trading bloc have warned that it will take several months before the vaccine will have a noticeable impact on infection rates.
That being said, investors may choose to dismiss these worrisome developments and turn their attention to the flurry of PMI and inflation releases coming out of the EU this week. Better-than-expected figures may discount the need for further easing from the European Central Bank and in turn underpin the Euro against the Greenback and the Yen.
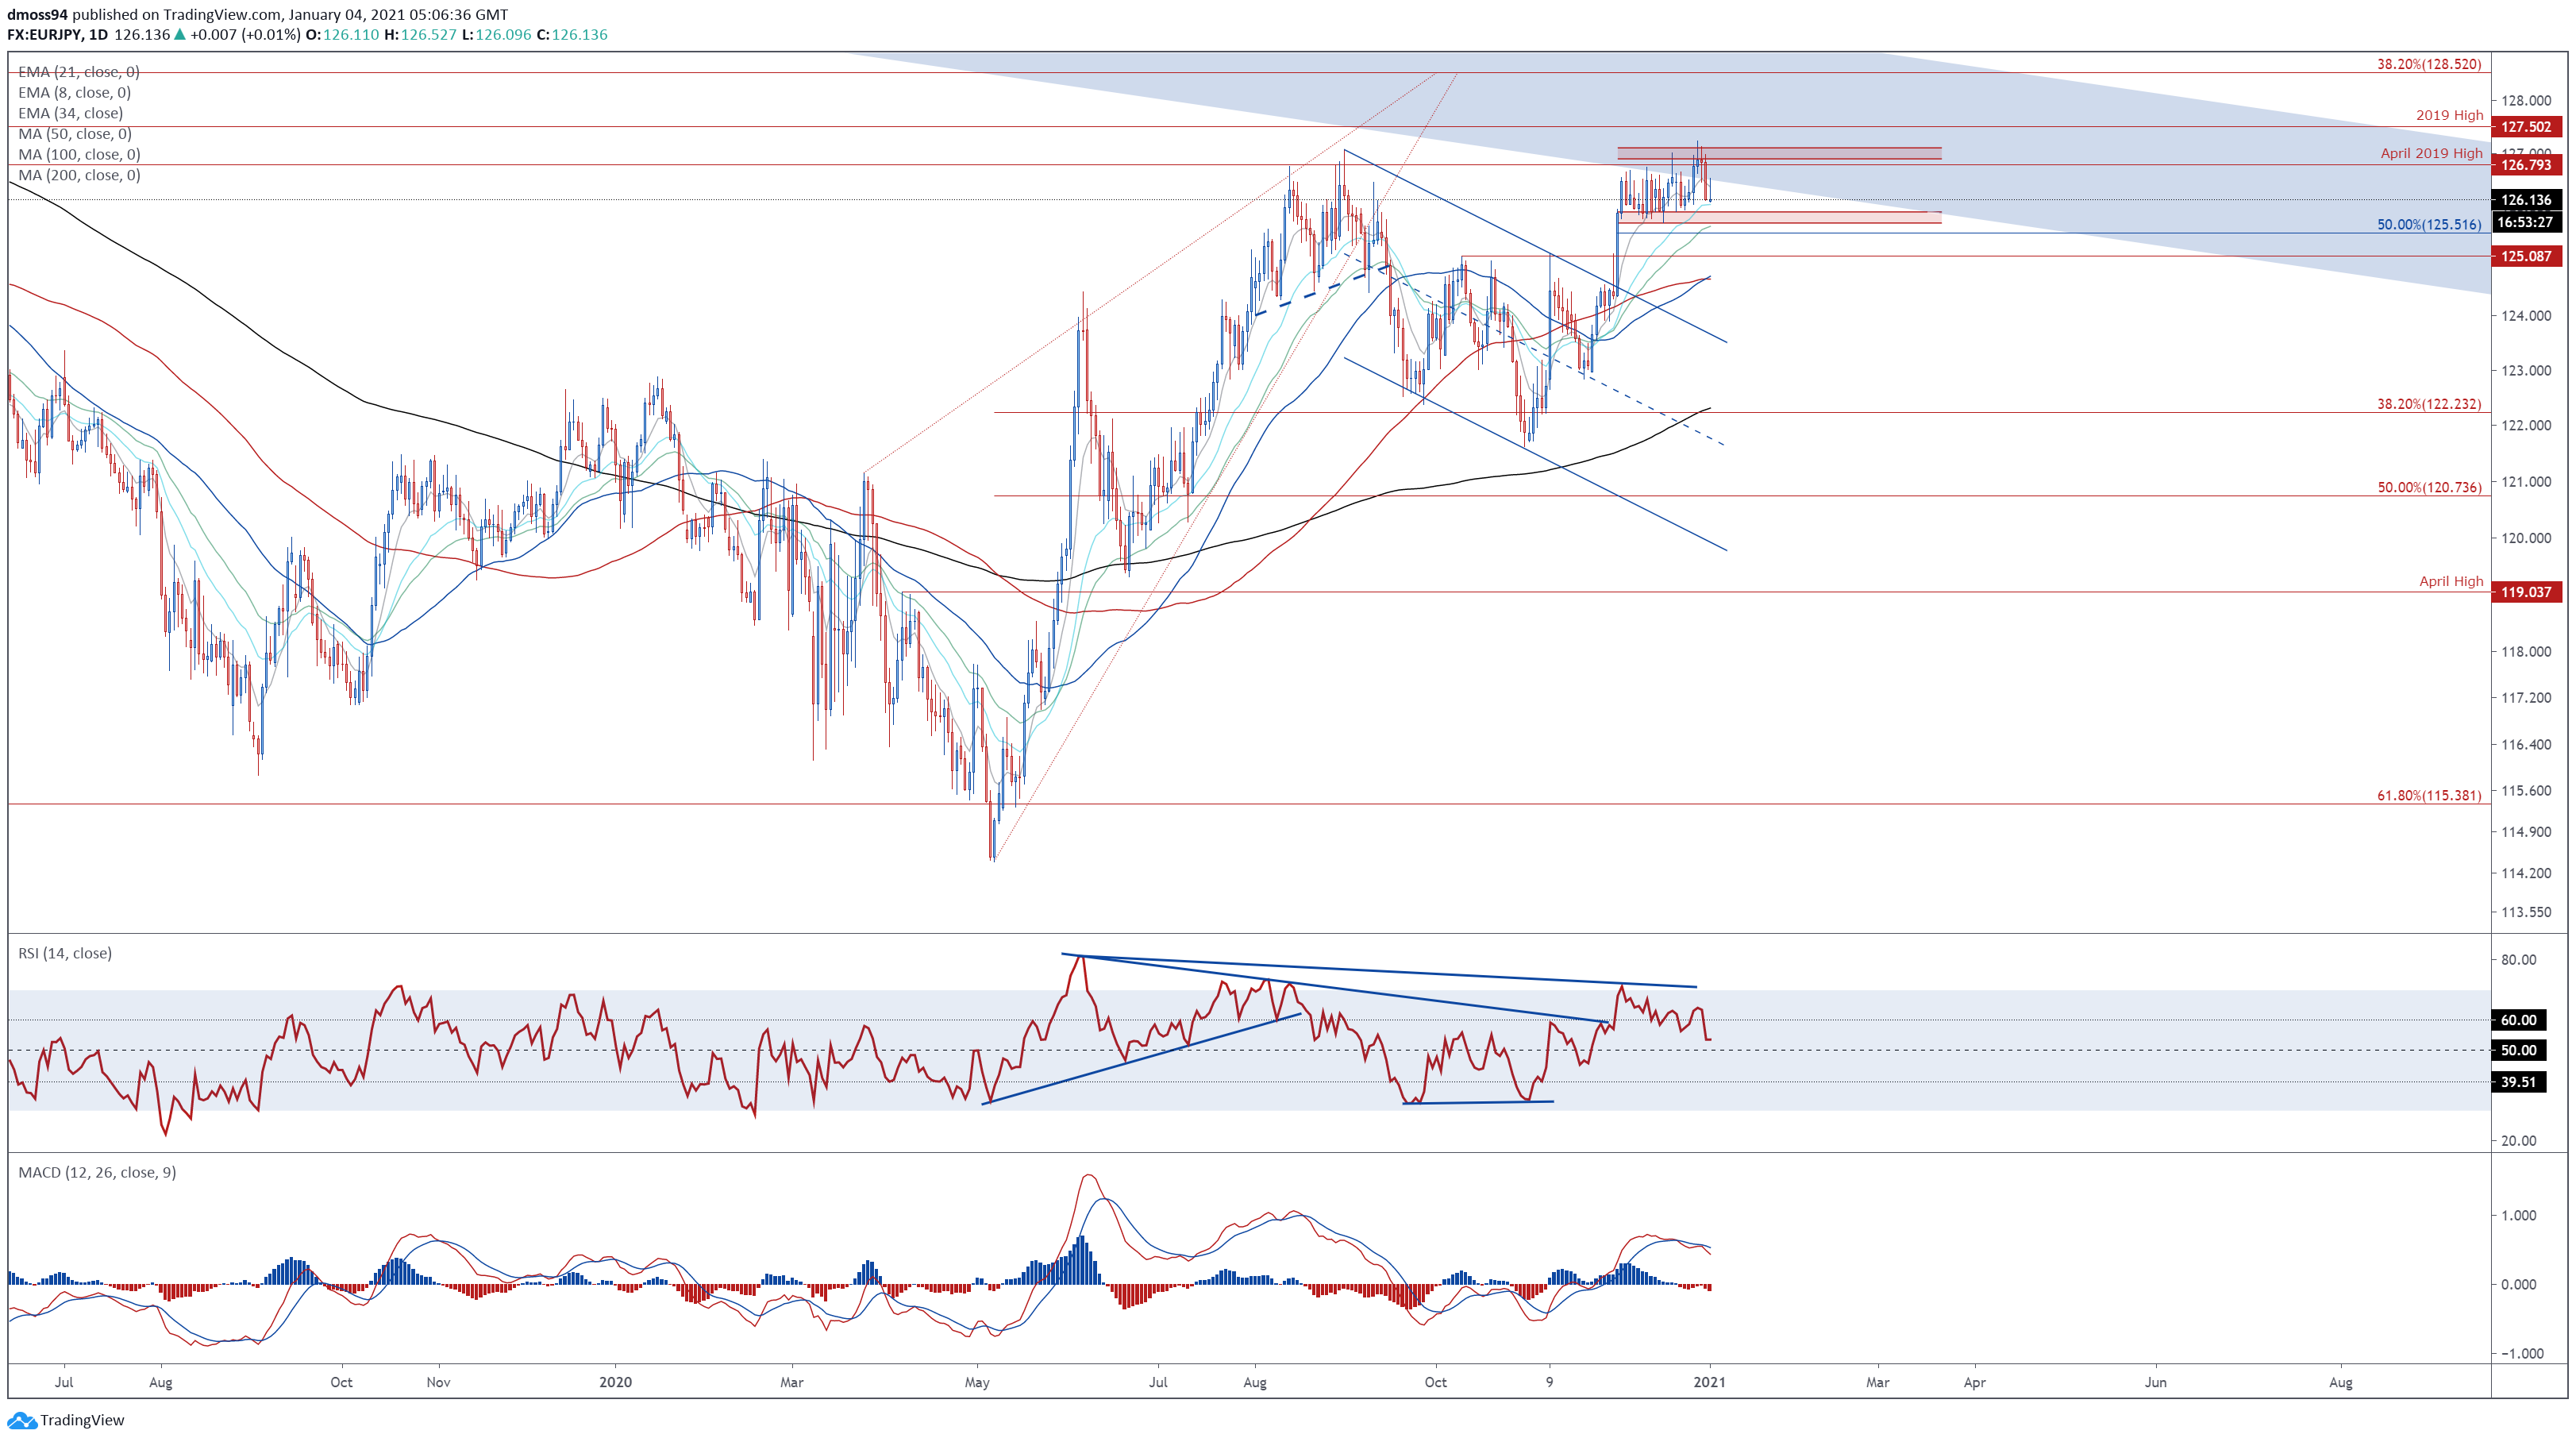
EUR/USD Daily Chart – Ascending Channel Guiding Price Higher
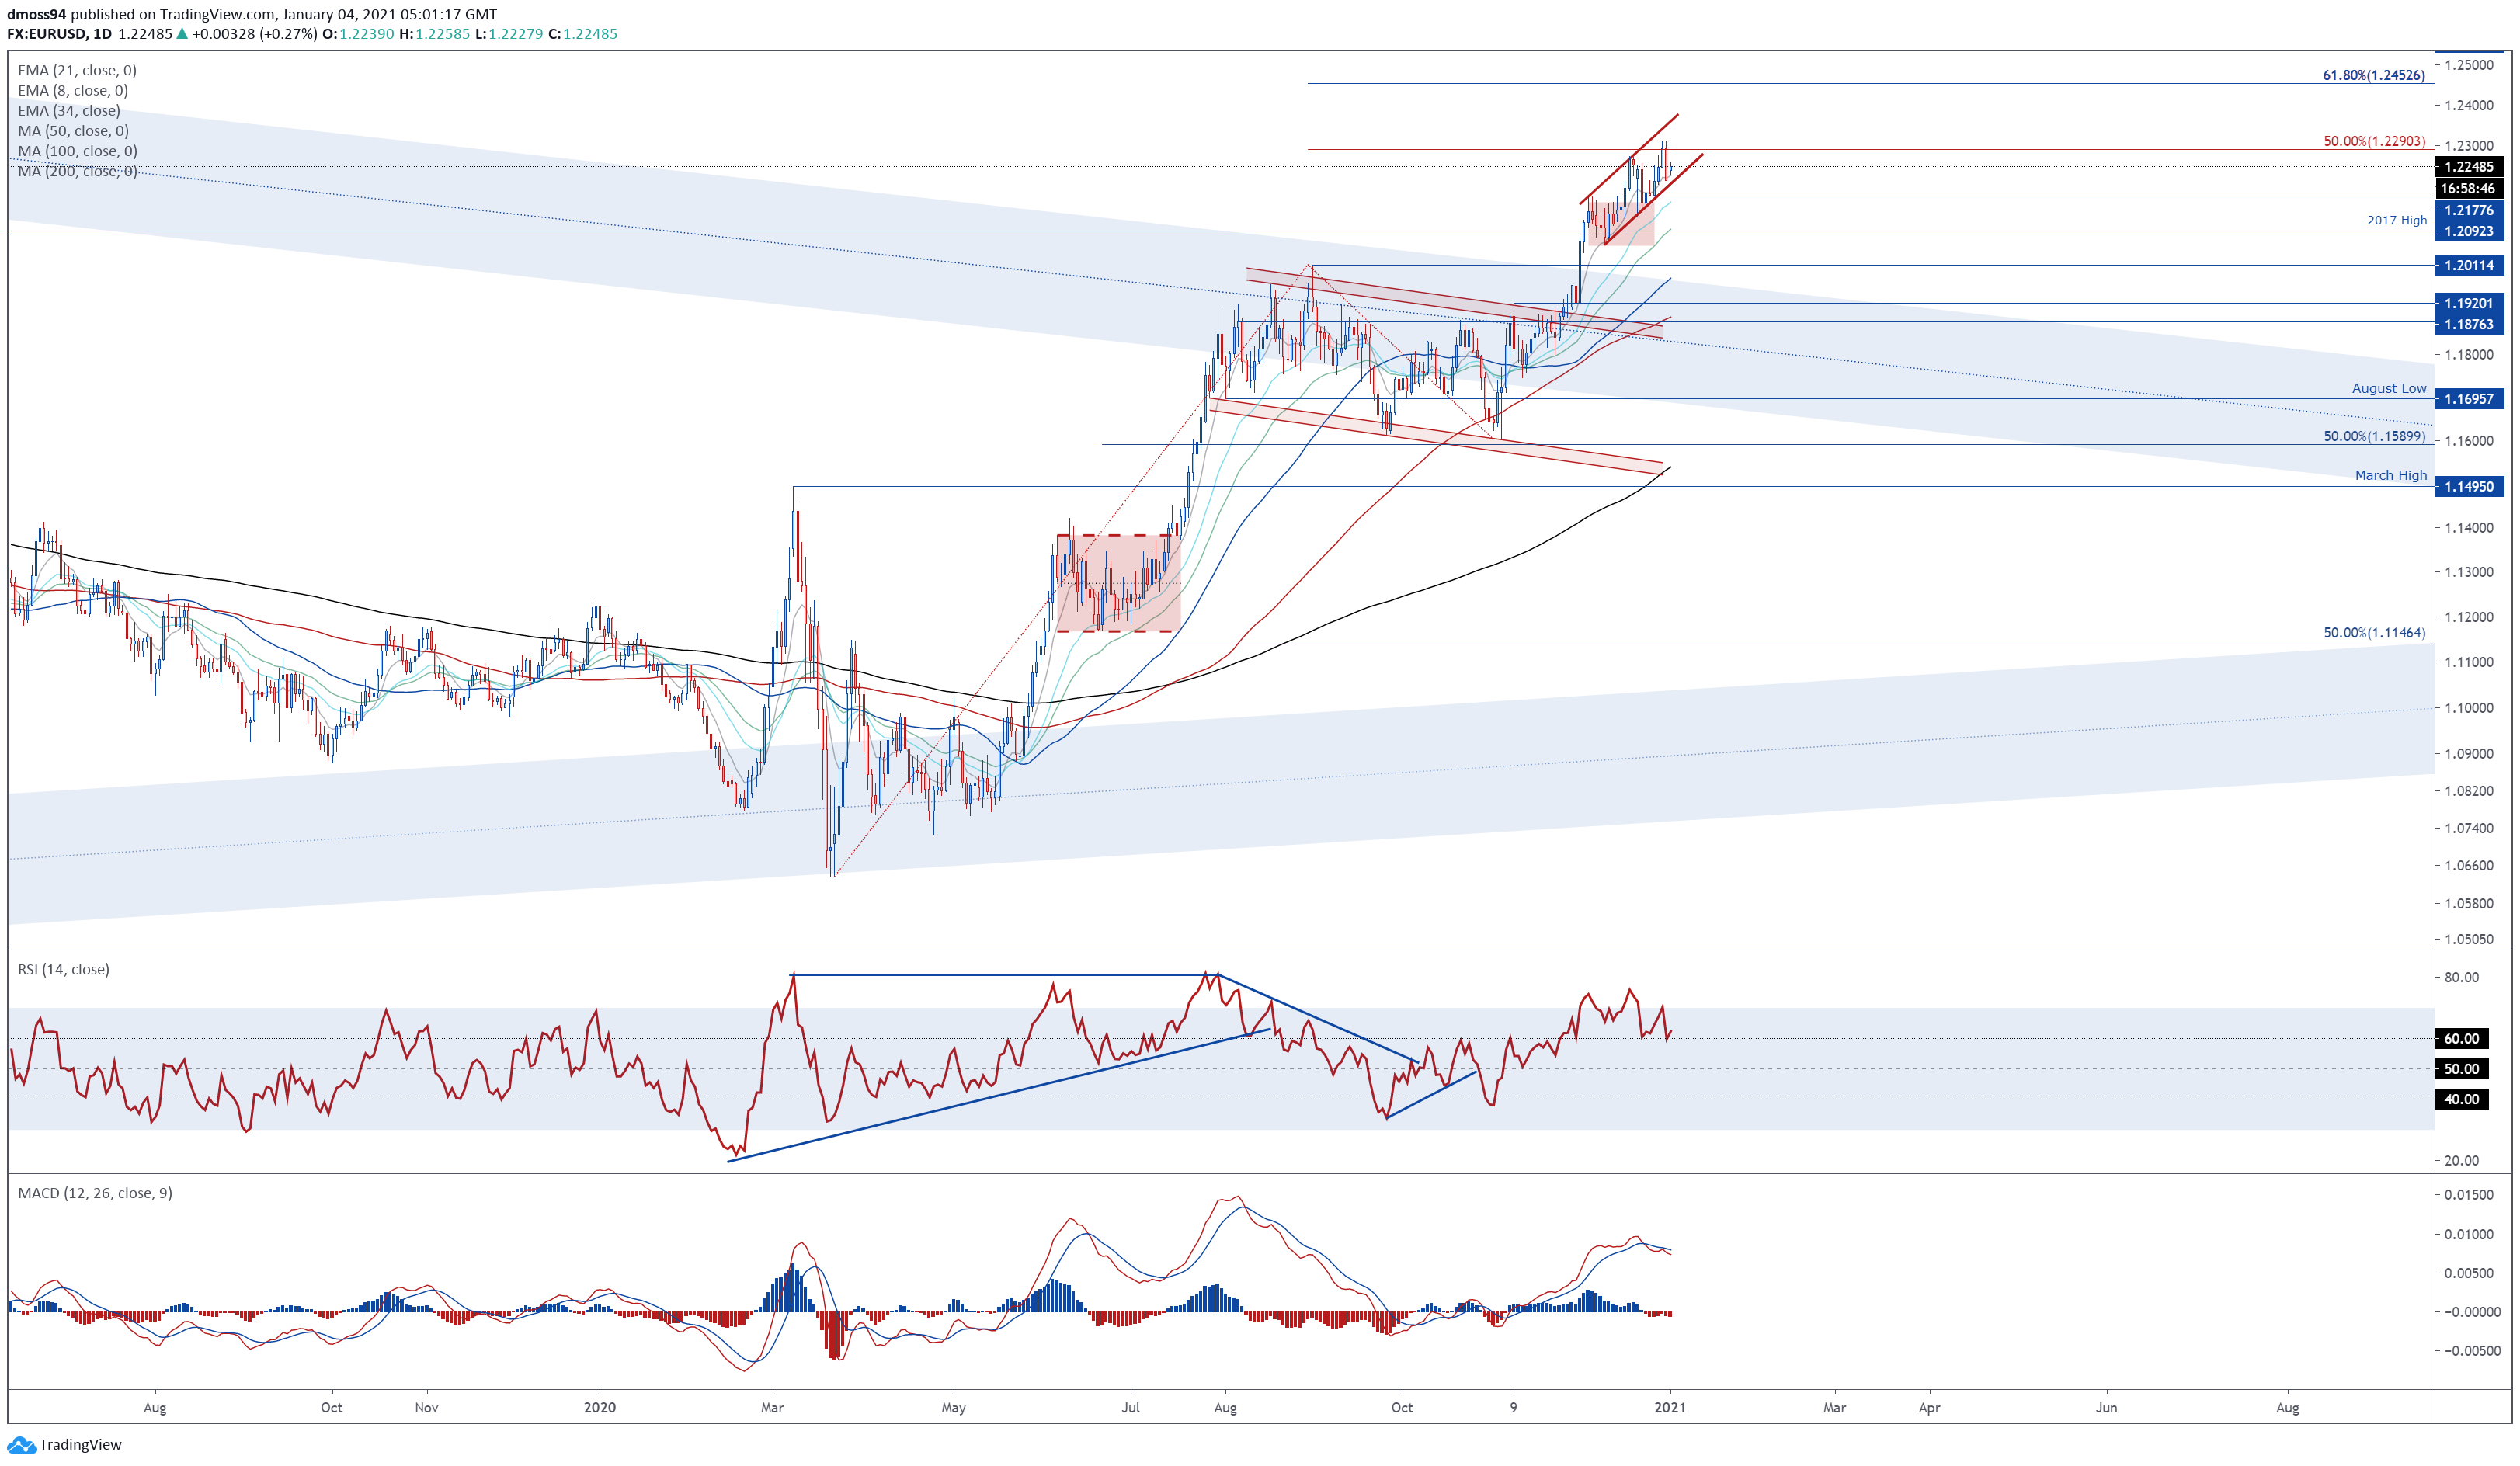
EUR/USD daily chart created using Tradingview
From a technical perspective, EUR/USD looks set to extend its push to multi-year highs, as price consolidates constructively above key support at the December 4 high (1.2178) and continues to track within the confines of an Ascending Channel.
Bullish moving average stacking, combined with the RSI holding above 60, suggests that the path of least resistance is higher.
A daily close above the 50% Fibonacci (1.2290) would likely signal the resumption of the primary uptrend and carve a path for prices to probe psychological resistance at the 1.2400 mark. Clearing that opens the door for buyers to challenge the 61.8% Fibonacci (1.2453).
Alternatively, slipping back below the 8-day exponential moving average (1.2227) and channel support could allow sellers to drive prices back towards confluent support at the 21-EMA and December 23 low (1.2154).
| Change in | Longs | Shorts | OI |
| Daily | -1% | -4% | -3% |
| Weekly | 4% | -10% | -5% |
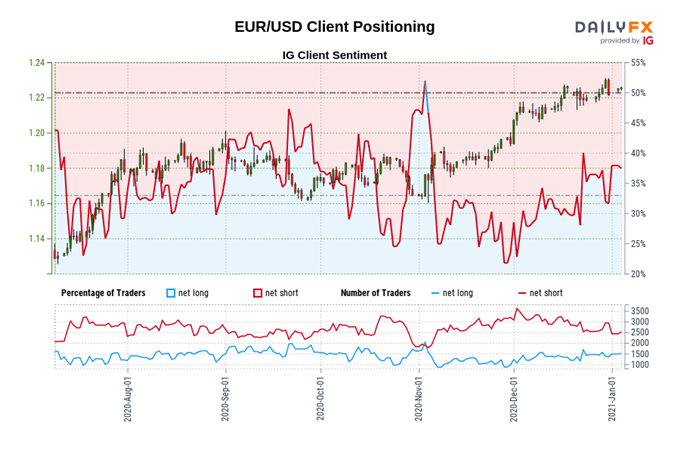
The IG Client Sentiment Report shows 38.09% of traders are net-long with the ratio of traders short to long at 1.63 to 1. The number of traders net-long is 6.97% higher than yesterday and 7.77% higher from last week, while the number of traders net-short is 6.07% higher than yesterday and 2.28% lower from last week.
We typically take a contrarian view to crowd sentiment, and the fact traders are net-short suggests EUR/USD prices may continue to rise.
Yet traders are less net-short than yesterday and compared with last week. Recent changes in sentiment warn that the current EUR/USD price trend may soon reverse lower despite the fact traders remain net-short.
EUR/JPY Daily Chart – Bull Flag in Play
EUR/JPY daily chart created using Tradingview
EUR/JPY rates also seem poised to push to multi-year highs, as prices carve out a Bull Flag continuation pattern just shy of psychological resistance at 127.00.
With both the RSI and MACD indicator tracking firmly above their respective neutral midpoints, and a Golden Cross moving average formation taking shape, an extended topside push looks likely in the near term.
Ultimately, a convincing push above range resistance at 126.90 – 127.10 is required to validate the bullish pattern and bring the 38.2% Fibonacci (128.52) into focus.
The pattern’s implied measured move suggesting that EUR/JPY could climb as much as 2% from current levels to test the 129.00 mark.
Conversely, breaching range support at 125.75 – 125.90 could nullify near-term buying pressure and generate a downside push back towards the October high (125.09).
| Change in | Longs | Shorts | OI |
| Daily | -9% | 0% | -3% |
| Weekly | 17% | -22% | -11% |
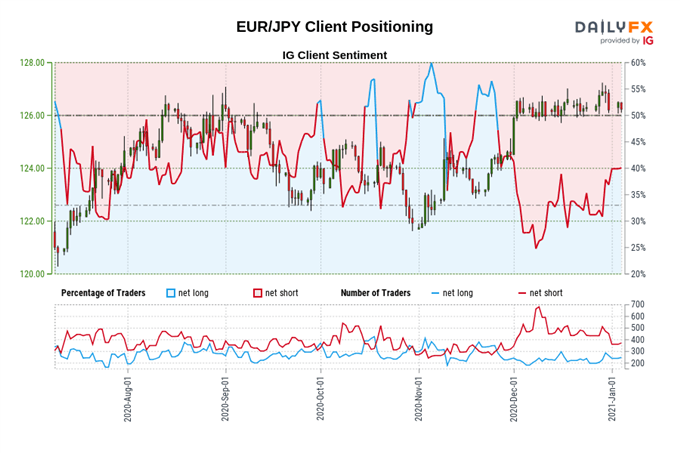
The IG Client Sentiment Report shows 40.16% of traders are net-long with the ratio of traders short to long at 1.49 to 1. The number of traders net-long is 5.06% higher than yesterday and 20.29% higher from last week, while the number of traders net-short is 3.63% higher than yesterday and 13.92% lower from last week.
We typically take a contrarian view to crowd sentiment, and the fact traders are net-short suggests EUR/JPY prices may continue to rise.
Yet traders are less net-short than yesterday and compared with last week. Recent changes in sentiment warn that the current EUR/JPY price trend may soon reverse lower despite the fact traders remain net-short.
-- Written by Daniel Moss, Analyst for DailyFX
Follow me on Twitter @DanielGMoss


