


S&P 500 Index, Fiscal Aid Negotiations, Coronavirus Restrictions, US Hospitalizations – Talking Points:
- Equity markets seemingly paused for breath during APAC trade.
- Renewed fiscal stimulus talks may underpin US benchmark equity indices.
- However, a record surge in hospitalizations may begin to gnaw at market sentiment.
- RSI divergence and fading volume hint at a near-term pullback for the S&P 500.
Asia-Pacific Recap
Equity markets moved marginally higher during Asia-Pacific trade, as investors mulled promising vaccine developments against a record surge in US coronavirus cases.
Australia’s ASX 200 index rose 0.38% after the nation posted its largest trade surplus in six months, while Japan’s Nikkei 225 held relatively steady.
China’s CSI 300 index dipped 0.11% on news that the US House of Representatives approved legislation that could result in Chinese firms being delisted from US stock exchanges.
In FX markets, the cyclically-sensitive AUD/USD pushed to fresh yearly highs, while the haven-associated Greenback and Japanese Yen continued to lose ground.
Gold prices rose 0.2% while yields on US 10-year Treasury notes flatlined at 94 basis points.
Looking ahead, a flurry of PMI prints out of Europe headline the economic docket alongside US jobless claims data for the week ending November 28.

Market reaction chart created using Tradingview
Fiscal Stimulus Talks to Underpin S&P 500
Promising coronavirus vaccine news and renewed fiscal stimulus hopes have propelled US equity markets higher in recent days, with the benchmark S&P 500 pushing to set a fresh yearly high on December 1.
A joint statement released by House Speaker Nancy Pelosi and Senate Minority Leader Chuck Schumer suggests that Democrats may be willing to lower their stimulus package demands, increasing the likelihood that a package could be passed before the end of the year.
Pelosi and Schumer said that the $908 billion bipartisan relief bill released on Tuesday should provide the starting point for negotiations, adding that “the need to act is immediate and we believe that with good-faith negotiations we could come to an agreement”.

Tellingly, Senate Majority Leader Mitch McConnell also hinted at the potential for both sides to come together in a bipartisan fashion, stating that Democrats were showing a “new willingness to engage in good faith”.
That being said, with McConnell circulating a $500 billion draft proposal that he believes is “something that would be signed into law by the president, be done quickly and deal with the things that we can agree on now”, it still seems relatively unlikely that these negotiations will bear fruit.
Nevertheless, with both sides of the aisle in agreement that some form of stimulus is necessary, negotiations looks set to continue at least in the short term. This may put a floor under the S&P 500, as market participants begin to price in the prospect of further fiscal support.
Tightening Covid-19 Restriction May Weigh on Sentiment
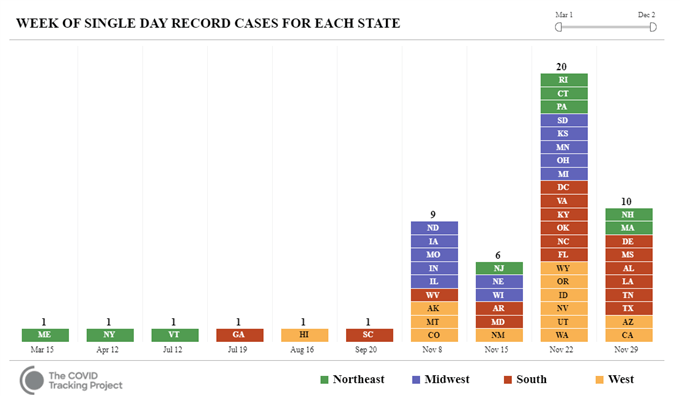
However, a record surge in US coronavirus hospitalizations and the potential tightening of restrictions in several states may begin to gnaw at market sentiment and weigh on risk-sensitive assets.
With the number of coronavirus patients surpassing 100,000, concerns are growing that the health care system may be stretched beyond its limits. Indeed, Californian Governor Gavin Newsom has warned that stricter restrictions may be needed to prevent intensive care units from being overwhelmed.
Moreover, with 30 states recording a record daily increase in infections in the last two weeks, the implementation of more stringent measures seems highly probable. This could take some of the wind out of the sails of US equity markets in the near term.
S&P 500 Index Futures Daily Chart – RSI Divergence Hints at Pullback
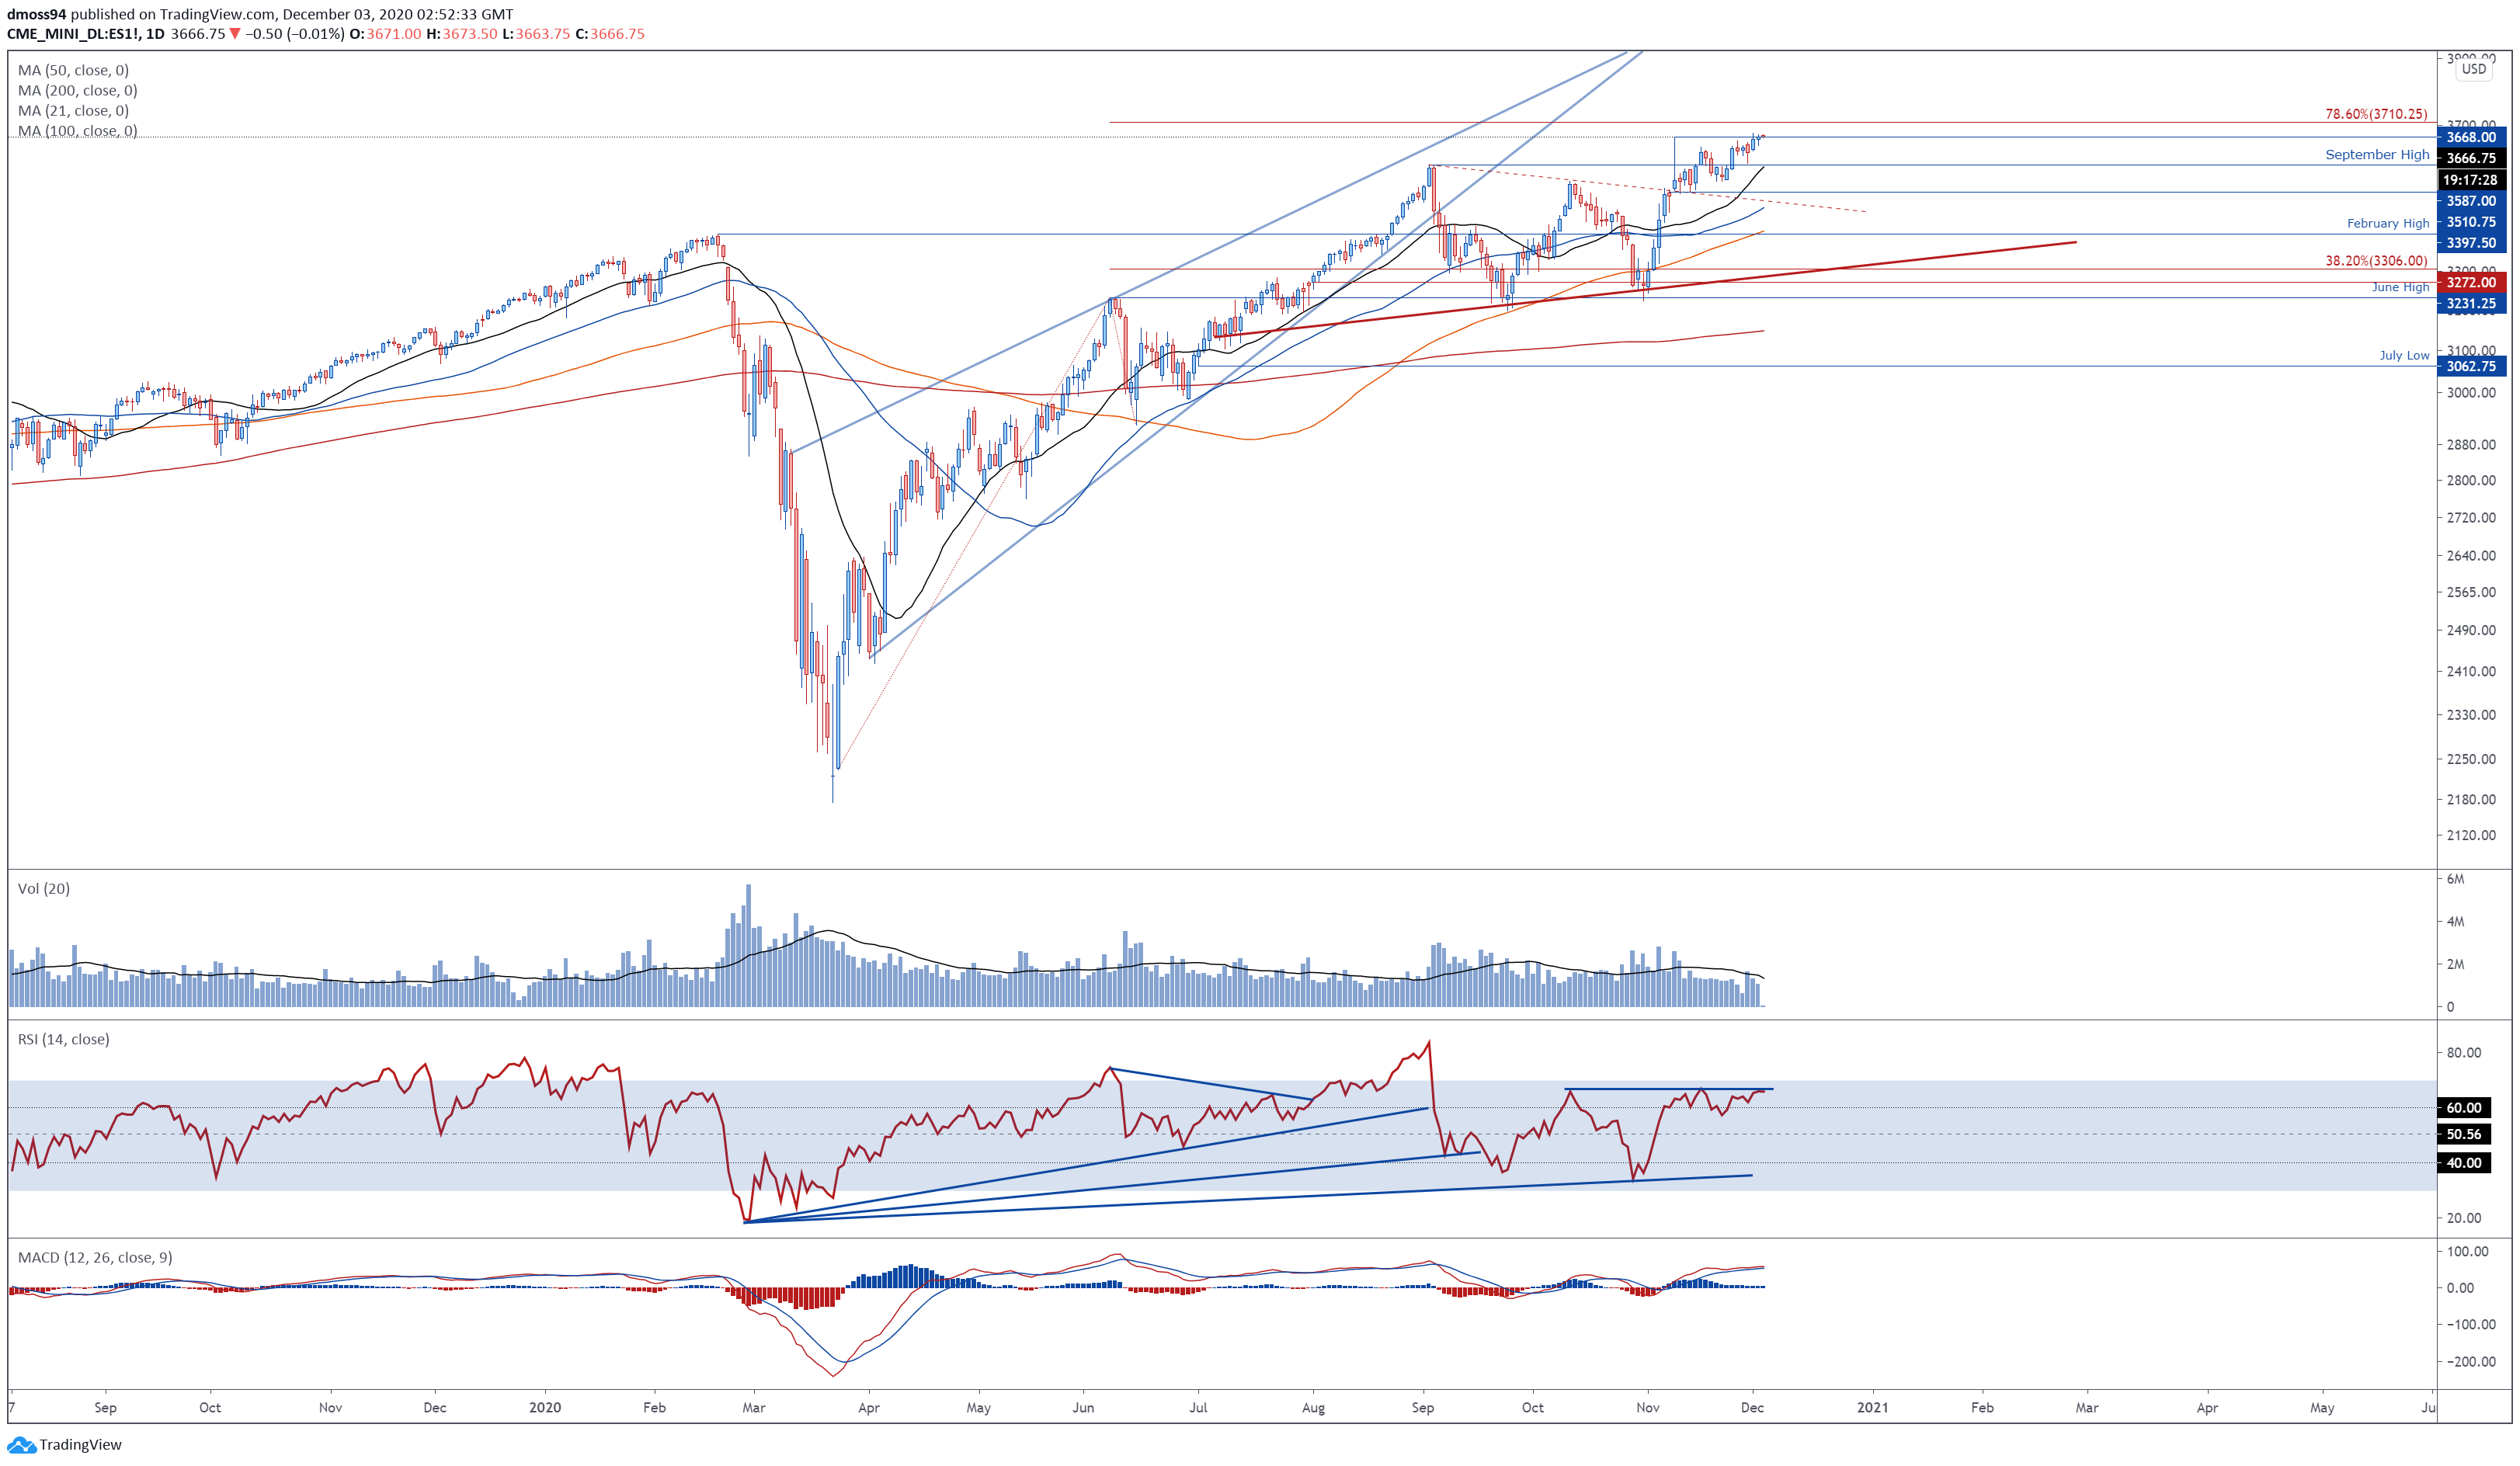
S&P 500 index futures daily chart created using Tradingview
From a technical perspective, the S&P 500’s outlook remains skewed to the topside, as price continues to track firmly above all four moving averages.
However, bearish RSI divergence, in tandem with fading volume, suggests that a near-term pullback could be on the cards.
The index may slip back towards support at the September high (3587) if price is unable to gain a firm foothold above the November high (3677.5) on a daily close basis.
Breaching that would probably open the door for a more extended downside move and bring the trend-defining 50-day moving average (3470) into play.
Alternatively, a daily close above 3680 would probably neutralize near-term selling pressure and bring the psychologically imposing 3800 level into play.
S&P 500 Index Futures 4-Hour Chart – Rising Wedge in Play?
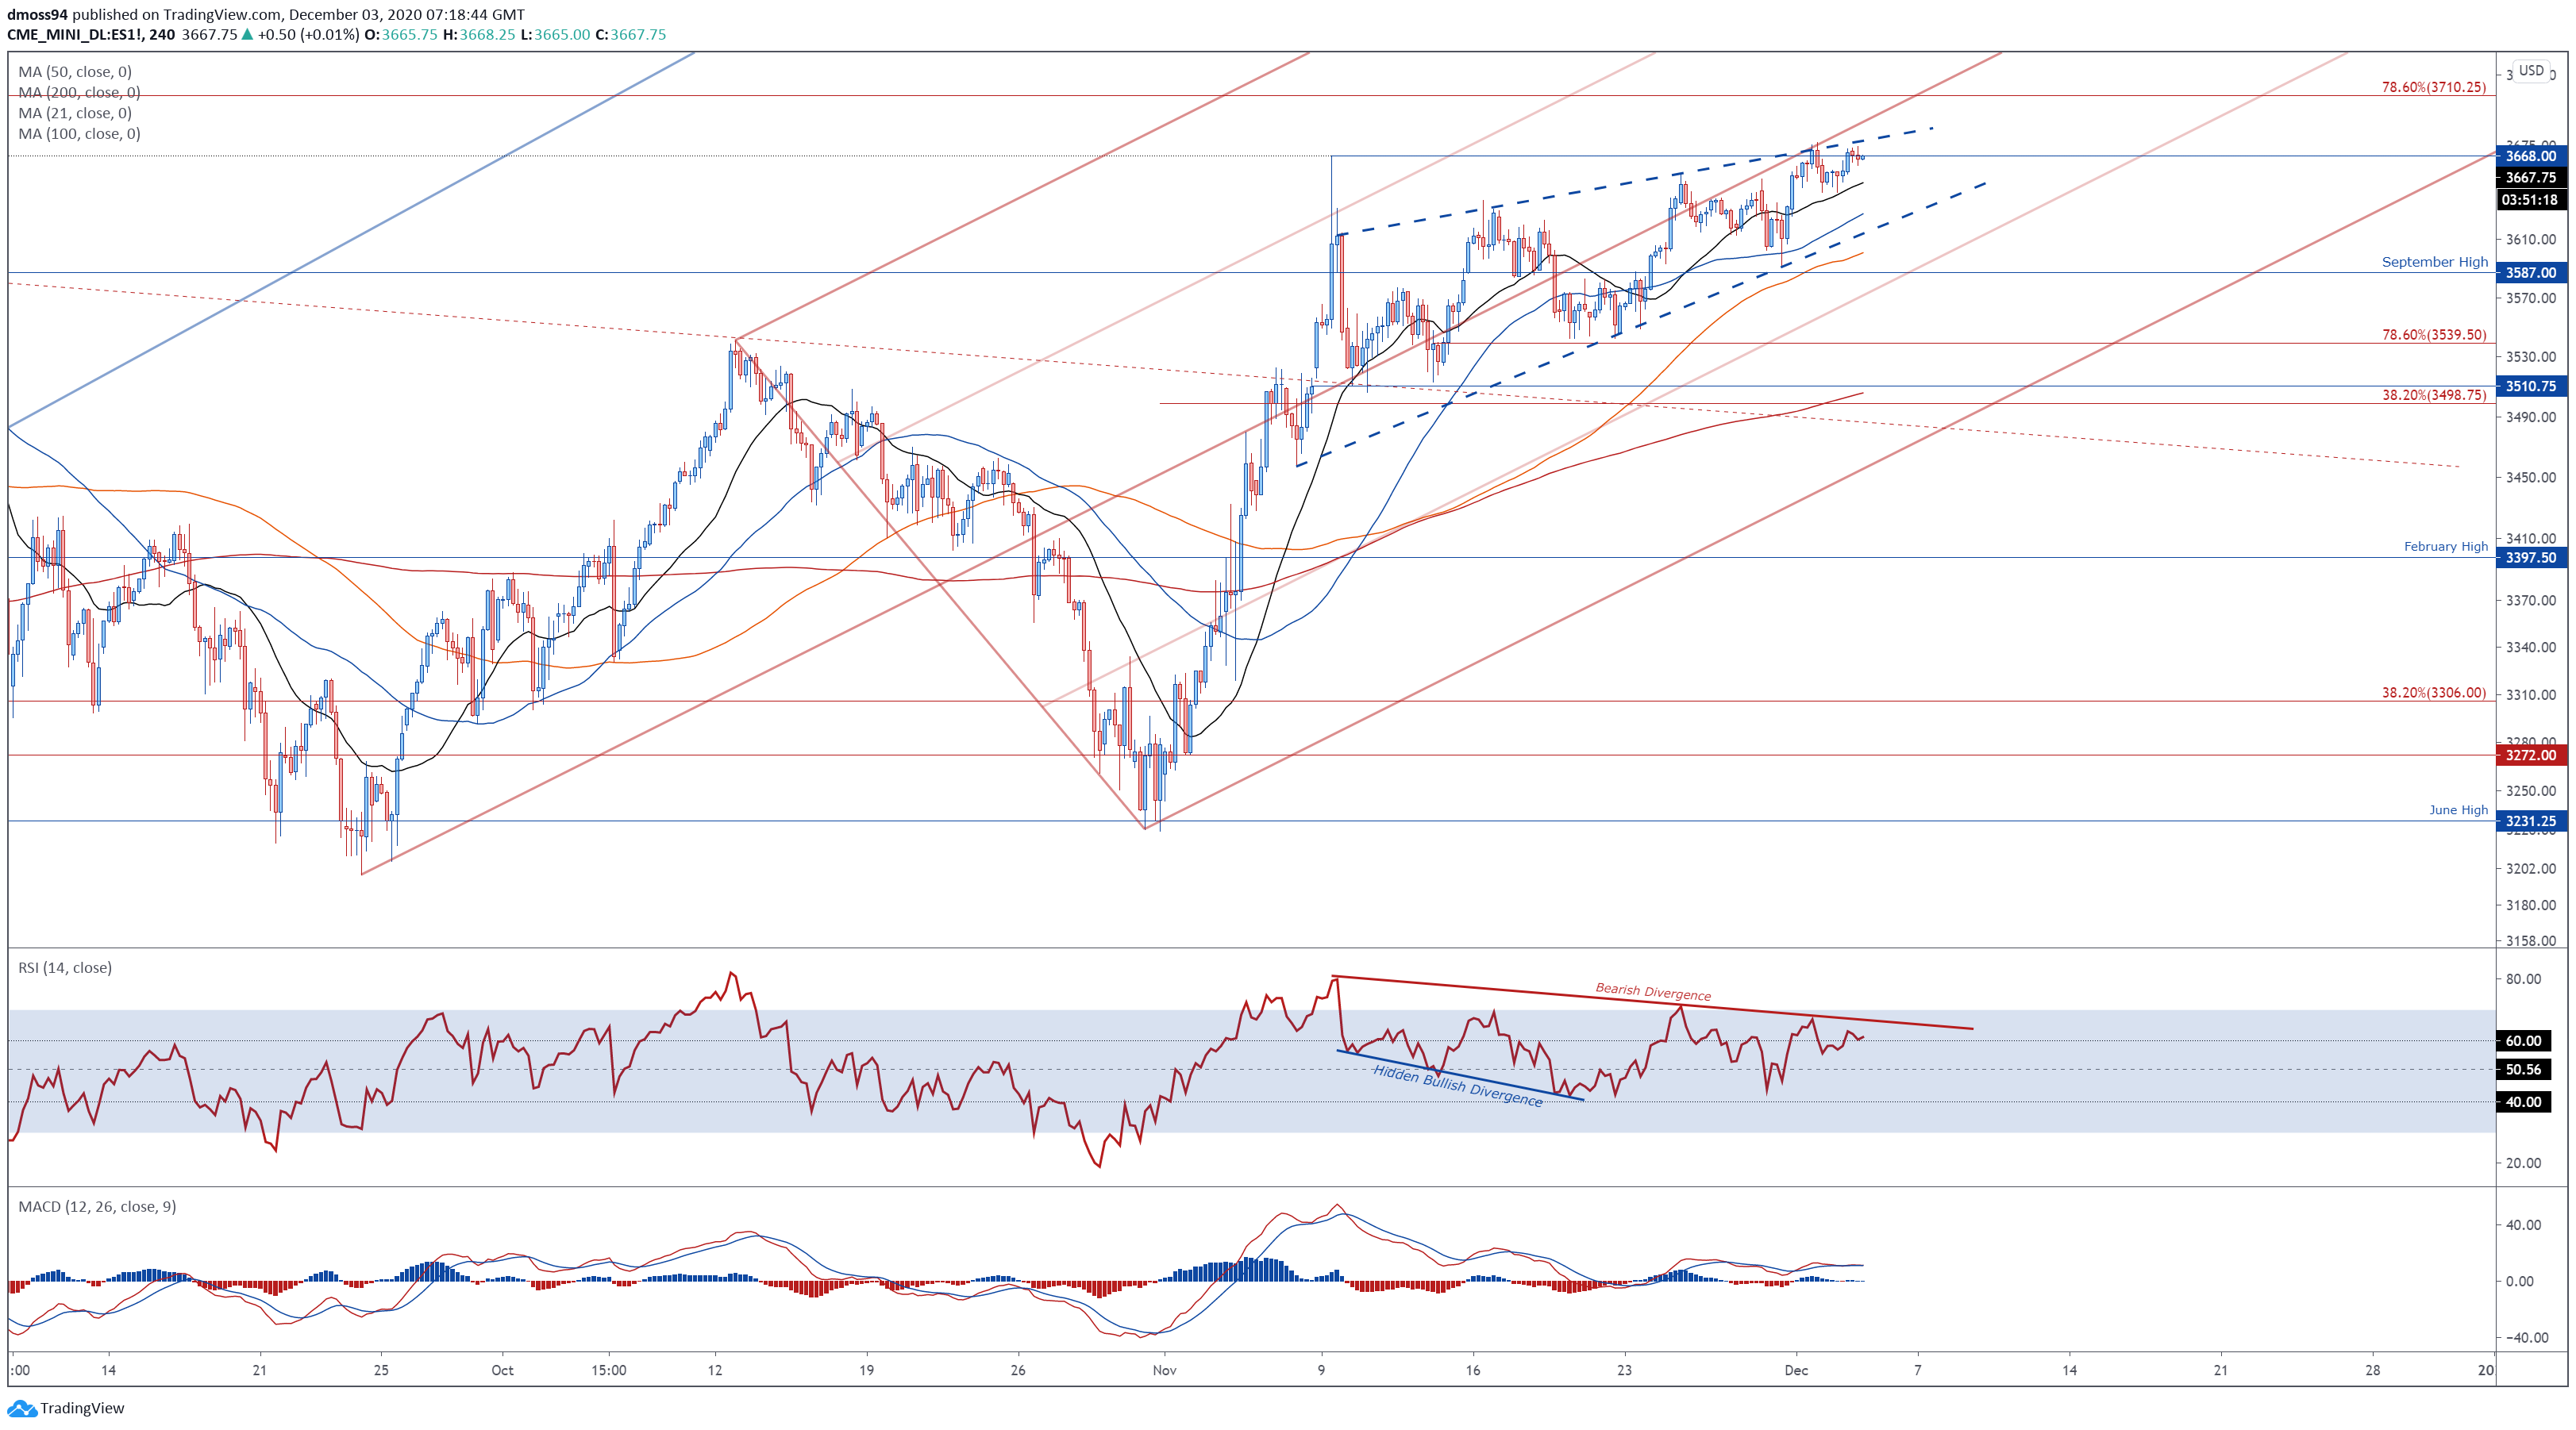
S&P 500 index futures 4-hour chart created using Tradingview
Zooming into a four-hour chart seems to reinforce the prospect of a short-term pullback, as prices carve out a bearish Rising Wedge pattern.
With the RSI failing to confirm the index’s move to higher highs, and the MACD indicator notably flatlining, the recent rally to fresh yearly highs seems to be running out of steam.
Slipping back below the November 9 high (3668) could generate a downside push towards the December low (3642), with a break below carving a path to challenge the 50-MA (3626) and wedge support.
Piercing that would likely validate the bearish reversal pattern and potentially ignite an extended downside push back towards the psychologically pivotal 3500 mark.
Conversely, pushing above the 3680 mark could carve a path to test the 78.6% Fibonacci (3710), with a break above opening the door for prices to probe the historic 3800 mark.
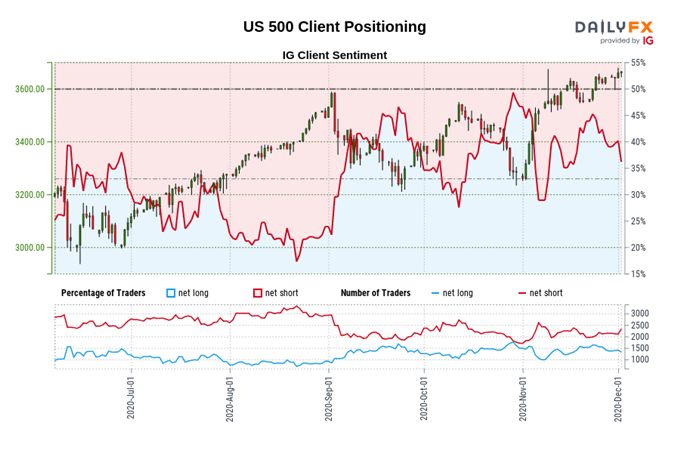
Retail trader data shows 38.84% of traders are net-long with the ratio of traders short to long at 1.57 to 1. The number of traders net-long is 3.80% higher than yesterday and 8.04% lower from last week, while the number of traders net-short is 3.89% lower than yesterday and 6.56% higher from last week.
We typically take a contrarian view to crowd sentiment, and the fact traders are net-short suggests S&P 500 prices may continue to rise.
Positioning is less net-short than yesterday but more net-short from last week. The combination of current sentiment and recent changes gives us a further mixed S&P 500 trading bias.
-- Written by Daniel Moss, Analyst for DailyFX
Follow me on Twitter @DanielGMoss


