


USD/CAD, Bank of Canada, Federal Reserve, Inflation, Economic Surprise Index – Talking Points:
- The Nikkei 225 index plunged during APAC trade after Japanese second quarter GDP showed the island-nation had suffered its most severe contraction on record.
- The differing stances of the Federal Reserve and Bank of Canada may be weighing on USD/CAD rates.
- USD/CAD rates poised for further declines after slicing through pivotal trend support.
Asia-Pacific Recap
The Nikkei 225 stock index slid lower during Asia-Pacific trade, as second quarter GDP showed the Japanese economy had suffered its most severe contraction on record.
The Japanese Yen fell after the announcement, whilst the US Dollar continued its slide against its major counterparts as the DXY plunged back below the psychologically pivotal 93 level.
Gold climbed back above the $1,950/oz mark and silver rebounded 1.7% as yields on US 10-year Treasuries faded back below 70 basis points.
Looking ahead, a relatively light economic docket may see traders turn their focus to developments between the US and China, after the cancellation of highly anticipated trade talks between the two economic powerhouses over the weekend.
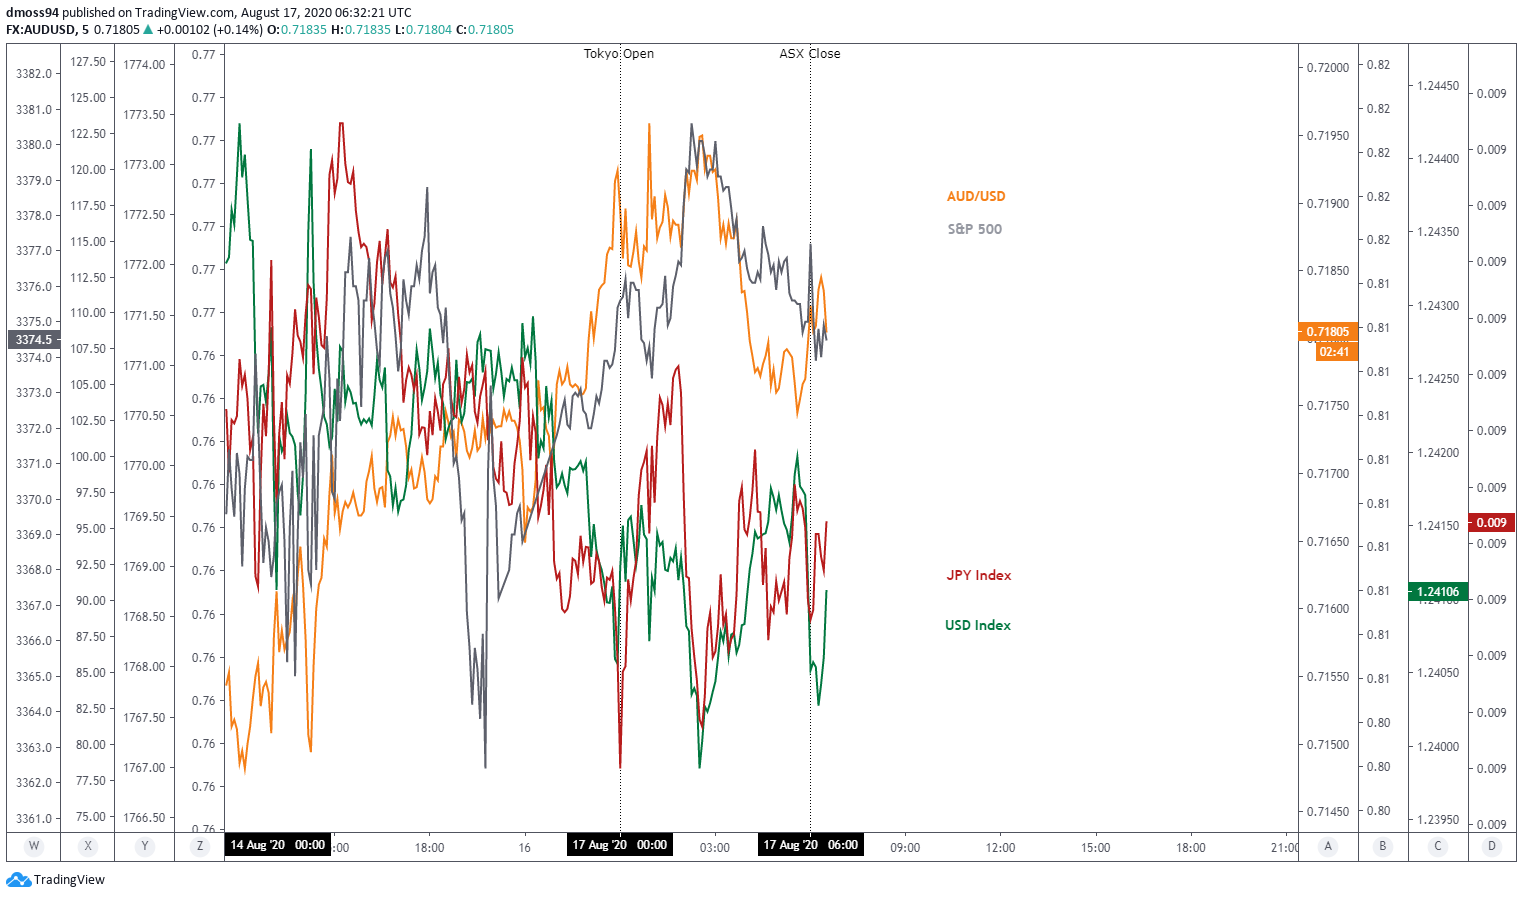
Market reaction chart created using TradingView
USD/CAD Slide Set to Continue as Fed Stimulus Weighs on USD
The Federal Reserve’s ultra-accommodative stance in response to the coronavirus pandemic has been a driving factor behind the significant decline seen in USD/CAD rates. The exchange rate has fallen over 10% after surging to a multi-year high (1.4669) on March 19.
The suggestion by Minneapolis Federal Reserve President Neel Kashkari that the central bank “must walk the walk and actually allow inflation to climb modestly above 2%” suggests that any tightening of current monetary policy settings is out of the question in the near term.
This intentional overshoot in inflation past the mandated 2% target is an idea unique to members of the US central bank and could continue to hamper the US Dollar against its Canadian counterpart, as Vice Chair Richard Clarida states that “the Federal Reserve will continue to act forcefully, proactively and aggressively as we deploy our toolkit – including our balance sheet, forward guidance, and lending facilities”.
Although the Bank of Canada has committed to “holding the policy interest rate at the effective lower bound until economic slack is absorbed so that the 2 percent inflation target is sustainably achieved [and] is prepared to provide further monetary stimulus as needed”, it seems unlikely that the Canadian central bank will be as loose as its US counterpart.
Therefore, upcoming inflation data may strengthen the Canadian Dollar if consumer prices exceed the consensus estimate of a 0.5% rise year-on-year in July. Buoying the risk-sensitive currency should market participants discount the likelihood of additional monetary stimulus measures from the BoC.
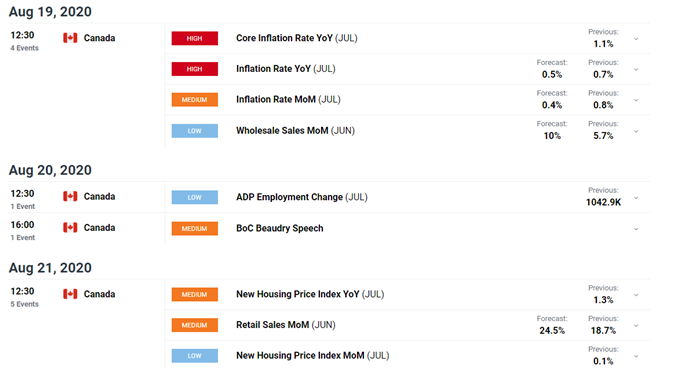
DailyFX Economic Calendar
Canadian Economic Performance Underpinning CAD
Outside of monetary policy influences, the surprising performance of the Canadian economy relative to expectations may also be a significant factor driving USD/CAD lower.
Overlaying the Citi Economic Surprise Index for Canada, alongside the index for the United States, shows that when the Canadian economy exceeds economic expectations by a greater margin than its US counterpart, USD/CAD rates noticeably decline.
However, this relationship doesn’t appear to be entirely inverse as the exchange rate seems to plateau in periods when the US economy is outperforming its North-American counterpart. Perhaps indicating that US economic data is being somewhat discounted by regional investors.
Despite a relatively small sample size, this trend should continue to be monitored and may give a greater amount of weight to upcoming retail sales and ADP employment data for the month of July.
Better-than-expected economic releases may fuel further USD/CAD weakness.
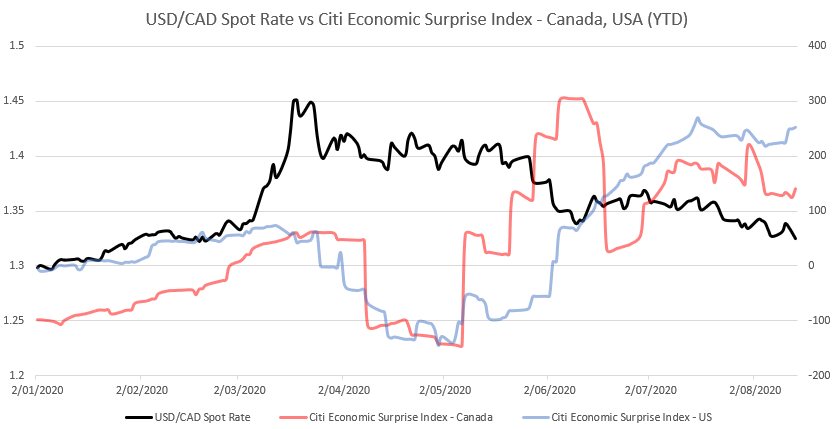
Data Source – Bloomberg
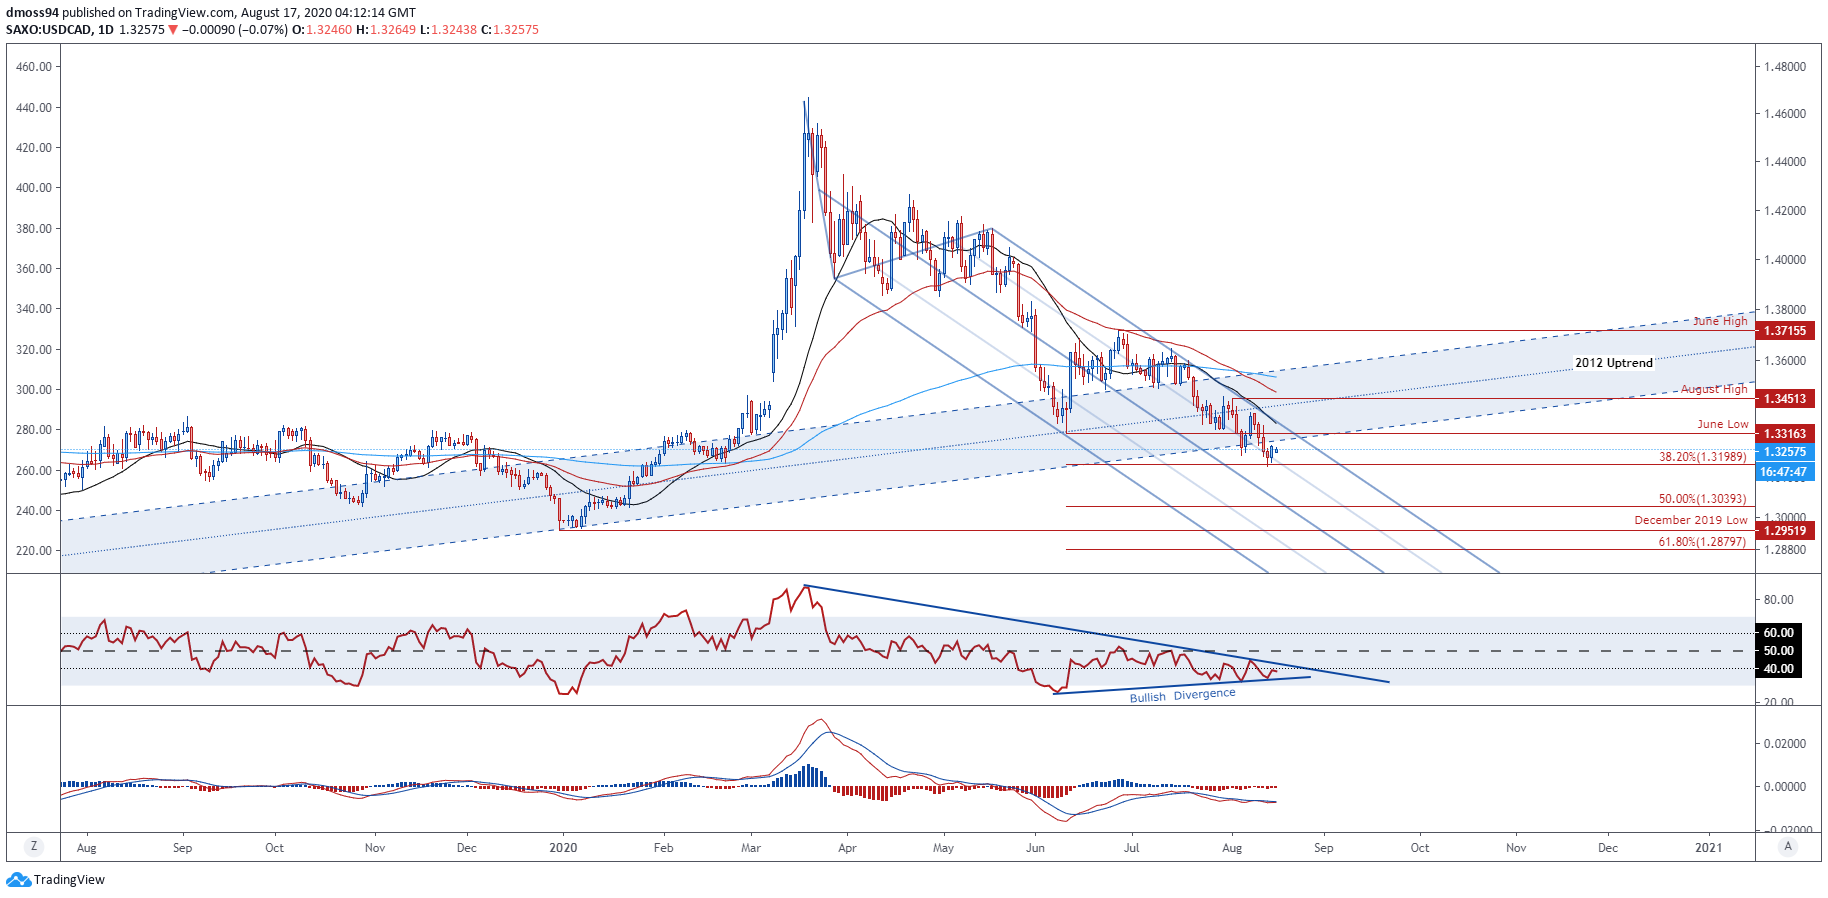
USD/CAD Daily Chart – Break of 2012 Uptrend Ominous for USD Bulls
From a technical perspective, the outlook for USD/CAD remains tilted to the downside as price tracks in a descending Schiff Pitchfork after breaking through pivotal support at the 2012 uptrend.
With the 21-, 50- and 200-day moving averages arranged in a bearish formation and the RSI struggling to break above its downtrend from the yearly extremes, an extension of the 5-month decline looks likely.
However, bullish RSI divergence suggests that the US Dollar could claw back some ground in the coming days, with support at the 38.2% Fibonacci expansion (1.3199) perhaps serving as a platform for price to retest resistance at the June low (1.3316).
That being said, the 21-DMA (1.3350) may stifle any significant attempt to break higher as it converges with the June low (1.3316) and Pitchfork parallel resistance.
Nevertheless, a daily close above the 1.3350 level is needed to invalidate bearish potential and could open a path back to the monthly high (1.3451).
On the other hand, a daily close below the 38.2% Fibonacci (1.3199) would probably signal the resumption of the primary downtrend and may bring into play the 50% Fibonacci (1.3039) and December 2019 low (1.2952).
USD/CAD daily chart created using TradingView
| Change in | Longs | Shorts | OI |
| Daily | -2% | 7% | 5% |
| Weekly | -30% | 38% | 13% |
-- Written by Daniel Moss, Analyst for DailyFX
Follow me on Twitter @DanielGMoss


